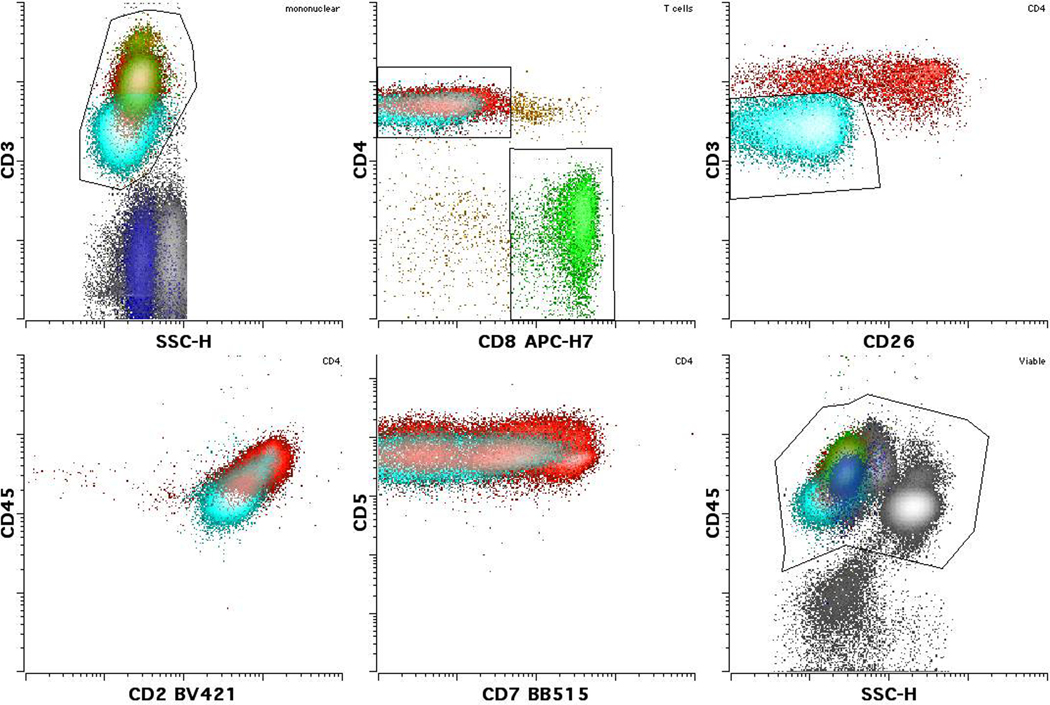
Figure 2:
Sezary/MF cells (light blue) often show a change in CD3 expression as seen in this case compared to either normal CD4 (red) or CD8 (green) positive T cells. Dimmer than normal CD3 expression is seen in this case, although (less frequently) brighter than normal expression may also be seen in other cases. Typically reduced or negative expression of CD26 and variably reduced CD7 are also present. Please note that normal T cells with reduced CD26 and CD7 may also be seen. Some cases also show reduced CD2 and altered CD45 (dim as in this case, or occasionally bright). CD5 is rarely altered. (Images courtesy Dr. M. Roshal, Memorial Sloan Kettering Cancer Center)

