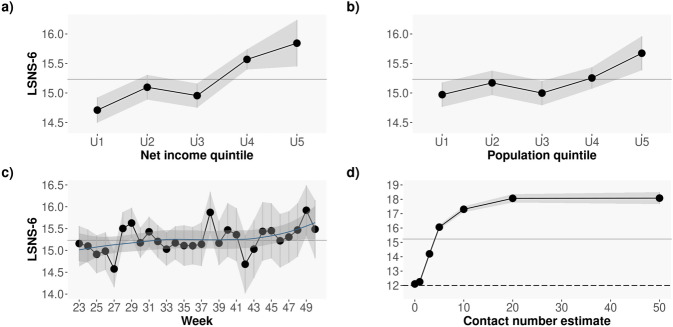
Figure 2.
Average LSNS-6 score by income (a) and population (b) in thousands, both obtained from the 2020 Spanish official statistics (INE) data according to the participants’ reported postal code. The larger the income and the larger the population, the lower the levels of social isolation; (c) Average LSNS-6 score by week of the year: from June 6th to December 16th, 2021; (d) Average LSNS-6 score by the number of close contacts in the last 7 days. Note how the larger the number of close contacts, the larger the LSNS-6 scores and hence the lower the levels of social isolation. The greyed area shows the 95% CI. The grey continuous line correspond to the overall average LSNS-6 for the entire sample: , .

