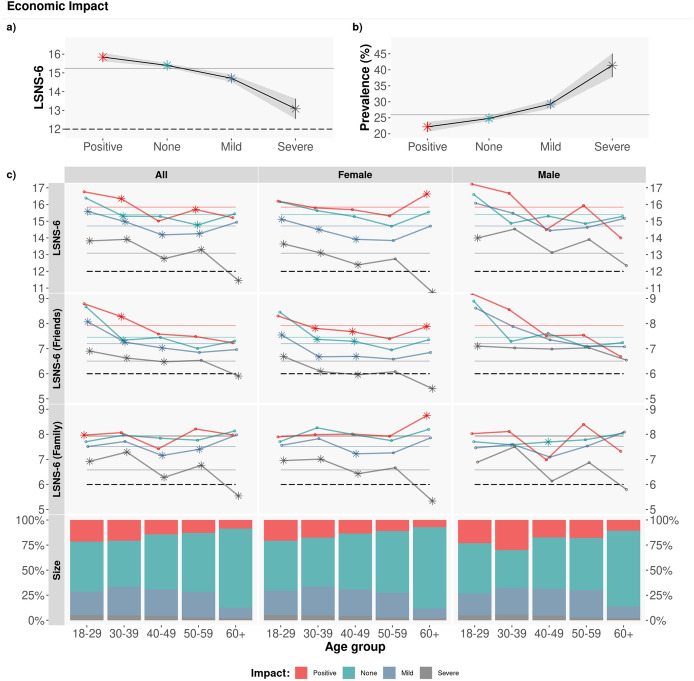
Figure 3.
Economic impact. Average LSNS-6 score by age group and gender. The coloured dashed lines correspond to the Overall/Friend/Family average LSNS-6 score per economic impact (Positive/None/Mild/Severe): : [15.84, 15.40,14.71, 13.09]; : [7.92, 7.94, 7.51, 6.58]; : [7.92, 7.45, 7.20, 6.51]. To test the statistical significance of the differences, we applied a Tukey post-hoc test after obtaining a significant difference via an ANOVA test. Asterisks denote statistically significant differences with the rest of groups with . Note how the more severe the economic impact, the lower the LSNS-6 scores and hence the larger the levels of social isolation.

