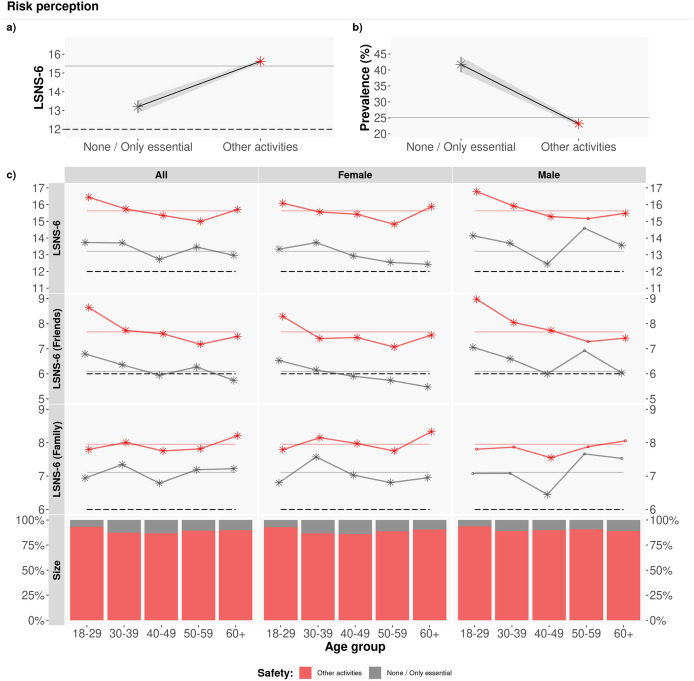
Figure 7.
Perception of COVID-19 infection risk for different types of activities. Average LSNS-6 score mean by age group and gender. The coloured lines correspond to the average Overall/Friend/Family LSNS-6 score per adopted COVID-19 protection measures (None/Other): : [13.20, 15.63]; : [7.10, 7.95]; : [6.09, 7.68]. The asterisks denote statistically significant differences, with a t-test with . Those who have a lower perception of risk linked to different daily-life activities (red lines) have significantly larger LSNS-6 scores than the rest of respondents (grey lines).

