. 2021 Jun 4;30(8):1591–1598. doi: 10.1158/1055-9965.EPI-20-1765

Figure 1.

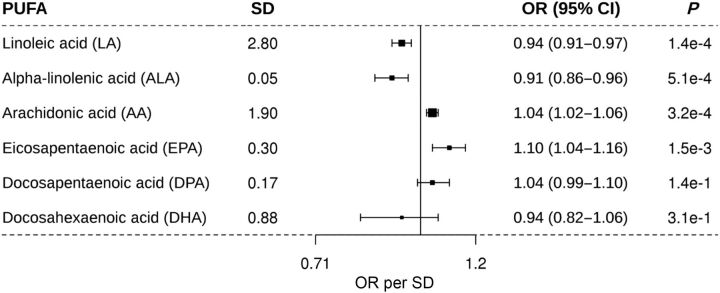
Figure 1. Association of one SD increase in genetically determined levels of PUFA and the risk of BCC. PUFA, polyunsaturated fatty acid; SD, standard deviation; OR, odds ratio per SD; and 95% confidence interval. The middle line represents the null (OR = 1.00), and the error bars represent 95% CI. The figure shows the MR results for the relationship between the six PUFAs and the risk of BCC.

Association of one SD increase in genetically determined levels of PUFA and the risk of BCC. PUFA, polyunsaturated fatty acid; SD, standard deviation; OR, odds ratio per SD; and 95% confidence interval. The middle line represents the null (OR = 1.00), and the error bars represent 95% CI. The figure shows the MR results for the relationship between the six PUFAs and the risk of BCC.