. 2021 Jun 4;30(8):1591–1598. doi: 10.1158/1055-9965.EPI-20-1765

Figure 3.

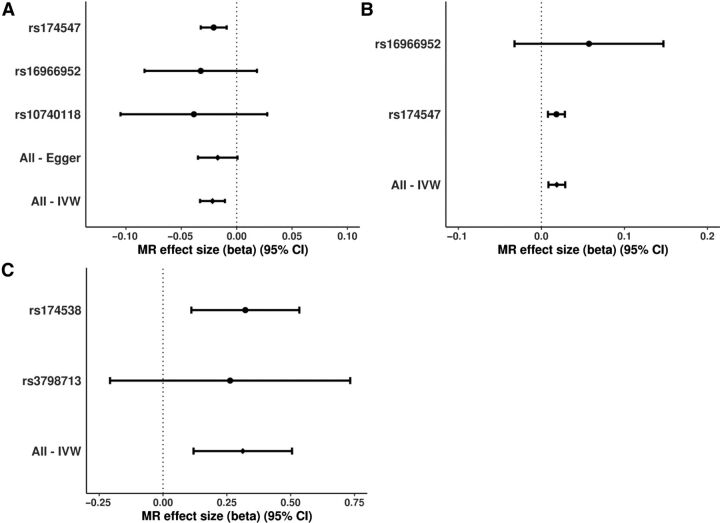
Figure 3. Forest plots of the individual SNP effects (log OR) for genetically predicted LA, AA, and EPA levels on BCC risk. This figure illustrates the contribution of individual IVs used for the association between LA (A), AA (B), EPA (C), and BCC risk. The error bars represent the individual SNP effects (beta or log OR) and the 95% CI derived using the IVW method or MR Egger for all SNPs and the Wald ratio method for instrumental variables. The vertical dotted line is the null (log OR). The figure shows that the results were not driven by a single IV.

Forest plots of the individual SNP effects (log OR) for genetically predicted LA, AA, and EPA levels on BCC risk. This figure illustrates the contribution of individual IVs used for the association between LA (A), AA (B), EPA (C), and BCC risk. The error bars represent the individual SNP effects (beta or log OR) and the 95% CI derived using the IVW method or MR Egger for all SNPs and the Wald ratio method for instrumental variables. The vertical dotted line is the null (log OR). The figure shows that the results were not driven by a single IV.