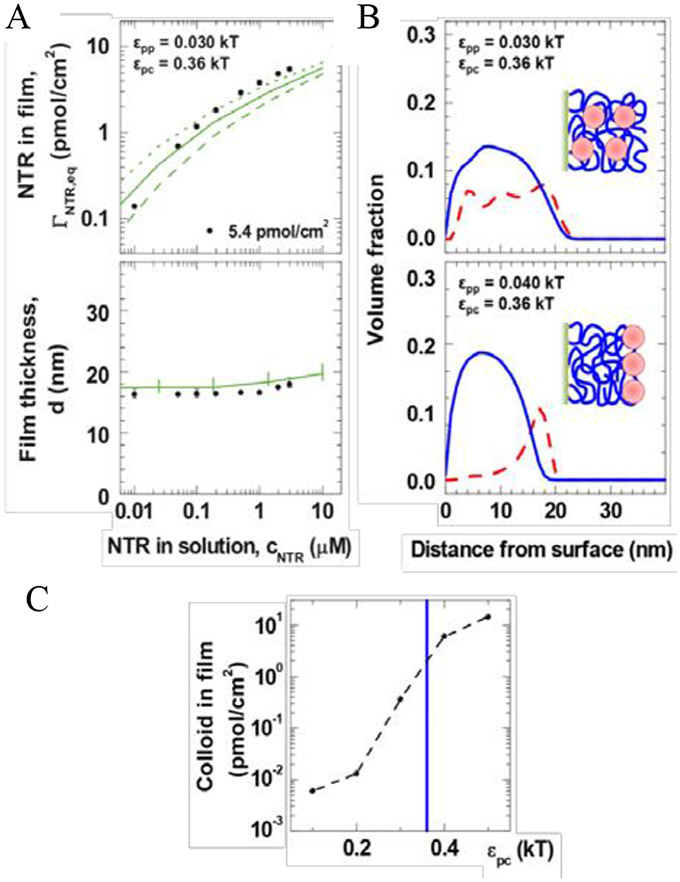
Figure 17.
Distribution of transport proteins within FG nups layers. A: Polymer models (lines) accurately describe the experimental results (symbols) on transport protein (NTR) uptake in grafted FG nup assemblies. B: Moderate changes in FG nup cohesiveness (εpp) can lead to qualitatively different distributions of transport proteins (red) in the FG assemblies (blue). C: these models predict a sharp decline in transport protein uptake when the attractive interaction (εpc) between FGs and transport proteins drops below experimentally relevant values (blue line). Adapted from [57], permission pending.

