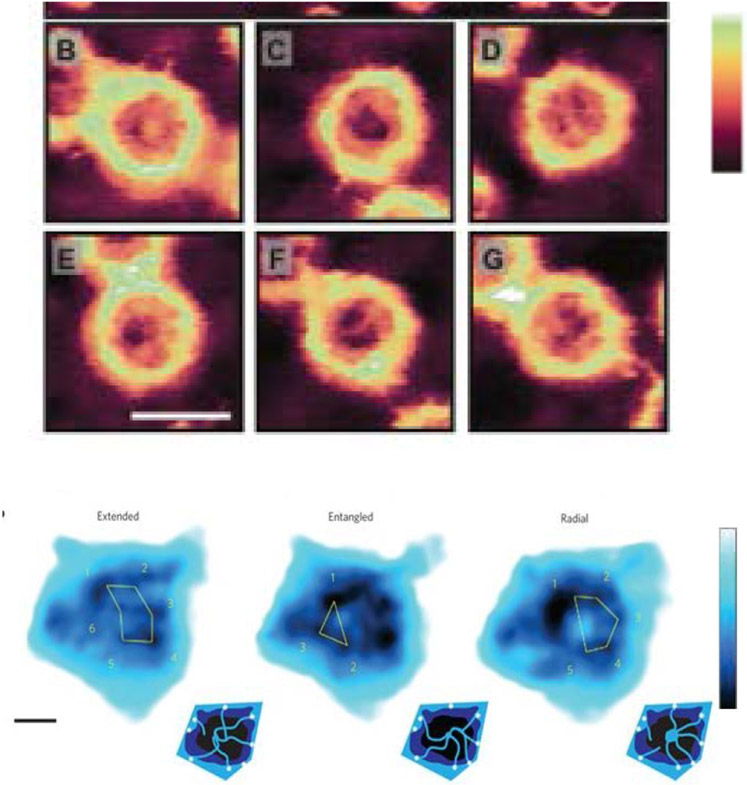
Figure 19.
AFM imaging of the NPC. Top: High-resolution AFM images of the cytoplasmic side of different NPCs in the same nuclear envelope. Adapted from [46], permission pending. Bottom: Different AFM images of the central channel of a single NPC, indicating dynamic FG nup behavior. Adapted from [42], permission pending. Scale bars: 100 nm (top); 10 nm (bottom). Color scales indicating heights: 0-60 nm (top); 0-4 nm (bottom).

