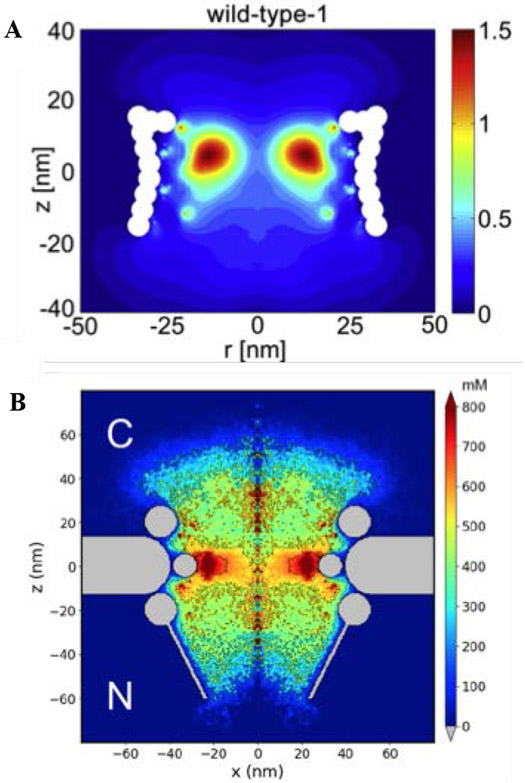
Figure 21.
Computational models of the FG nup distribution in the yeast NPC using one-bead-per-amino-acid models. Both models (although with different scaffold geometry and force field parametrization) predict a donut-shaped density profile of FG nups in the pore (in the absence of transport proteins). (Legends) A: Time-averaged FG-nup number density (in nm−3); adapted from [62], B: Amino-acid density distribution (in mM); adapted from [169], permission pending.

