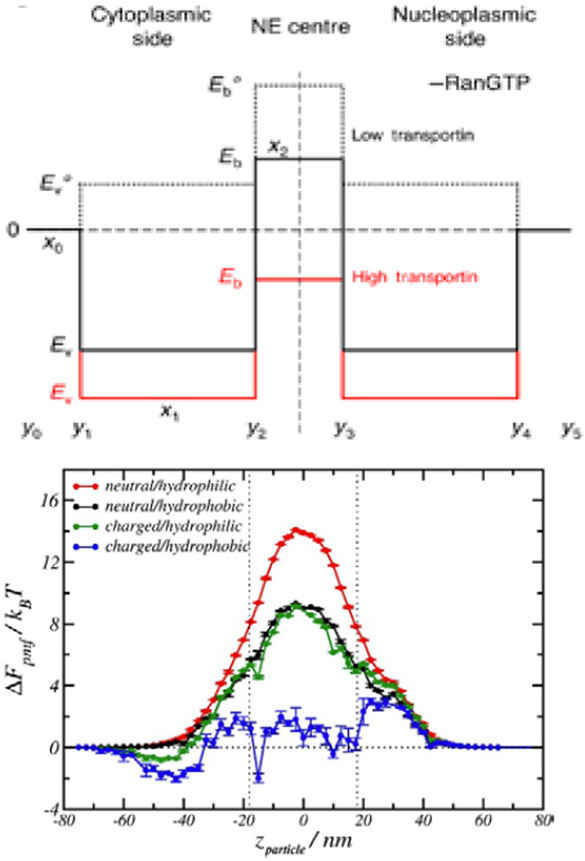
Figure 34.
Inferred effective potential profiles along the axis of the NPC from single molecule trajectory tracking. Dashed lines: neutral particles. Black lines: particles with weak attraction to the FG nups. Red lines: particles with strong attraction with the FG nups. Reproduced from [330], permission pending. Bottom panel: Computational effective potential profile (pmf) along the NPC axis for particles of different surface properties. Reproduced from [63], permission pending.

