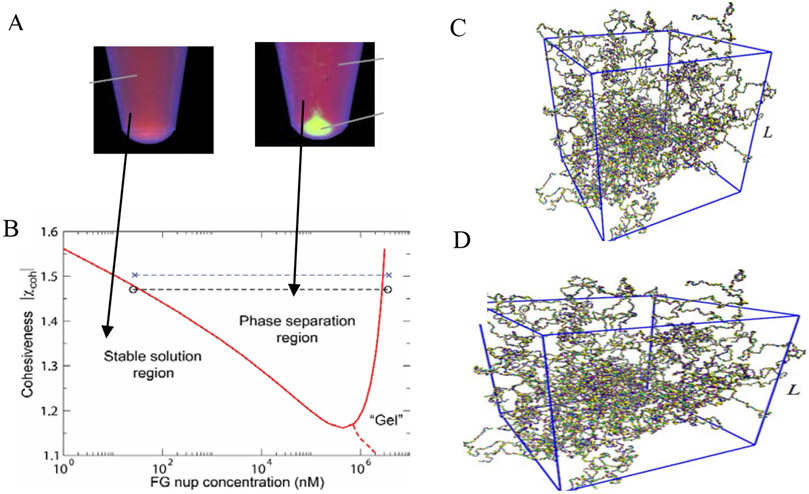
Figure 7.
Phase separation and gelation in solutions of FG nups. A: Dense aggregates (yellow “droplet”) are formed by cohesive FG nups at sufficiently high concentrations. Adapted from [98], permission pending. B: Phase diagram of an FG nup solution obtained using Flory-Huggins type theory of Eq. (3). The red line indicates the theoretically predicted boundary of the phase separation region. Dashed line: schematic boundary of the formation of the percolating “gel”. Symbols: experimentally observed densities of the dilute and the dense phase. Reproduced from [156], permission pending. C: Gelation in FG nup solutions studied by a molecular dynamics model with one bead per amino acid. D: Critical concentration for gel formation ccrit as a function of the charge C, hydrophobicity H, and FG nup length N, as follows from applying percolation theory to the simulation results. The results show that hydrophobic interactions are the main driving force for gel formation in FG-nup solutions, reflected in the increase of the critical concentration for gel formation increases with the charge-to-hydrophobicity ratio. Adapted from [157], permission pending.

