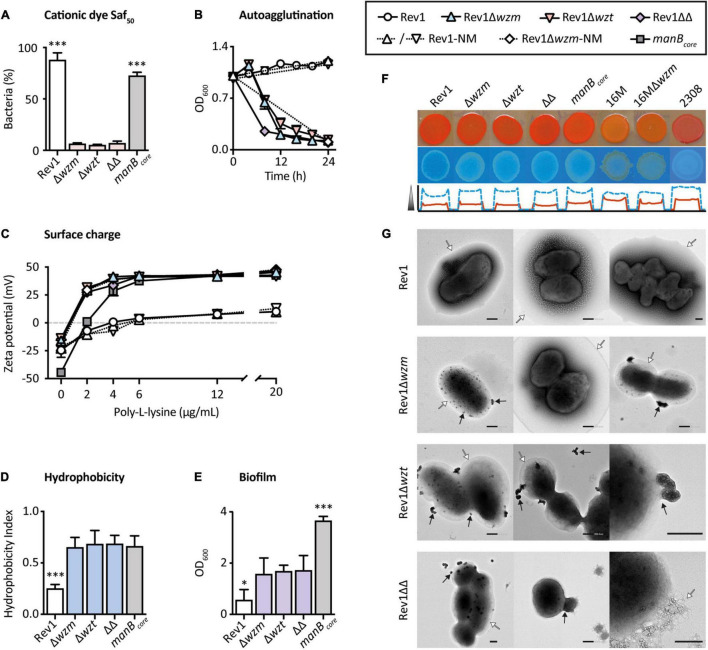
FIGURE 3.
Outer membrane properties of wzm/wzt mutants are modified in comparison with Rev1. (A) Inhibition by the cationic dye safranin O at 50 μg/ml (Saf50) in BAB-S and 10% CO2 represented as surviving bacteria (%; mean ± SD; n = 3) vs. the standard growth condition. (B) Autoagglutination in static culture determined by spectrophotometry (mean ± SD; n = 2; representative result). (C) Surface charge measured by Zeta-potential (mean ± SD) in absence (n = 4) or presence (n = 2) of poly-L-lysine. (D) Hydrophobicity based on differential partitioning in aqueous-hydrocarbon solution (mean ± SD; n = 3). (E) Biofilm formation quantified by crystal violet staining (mean ± SD; n = 3). (F) EPS analysis by the intensity of Congo Red (upper row; red line) or Calcofluor (the low row; the discontinuous blue line). (G) Representative TEM images with negative stain in which EPS and OMVs are indicated by white and black arrows, respectively; scale bars = 200 nm. Fisher’s LSD test; ***p ≤ 0.001, *p ≤ 0.05 vs. the other groups.

