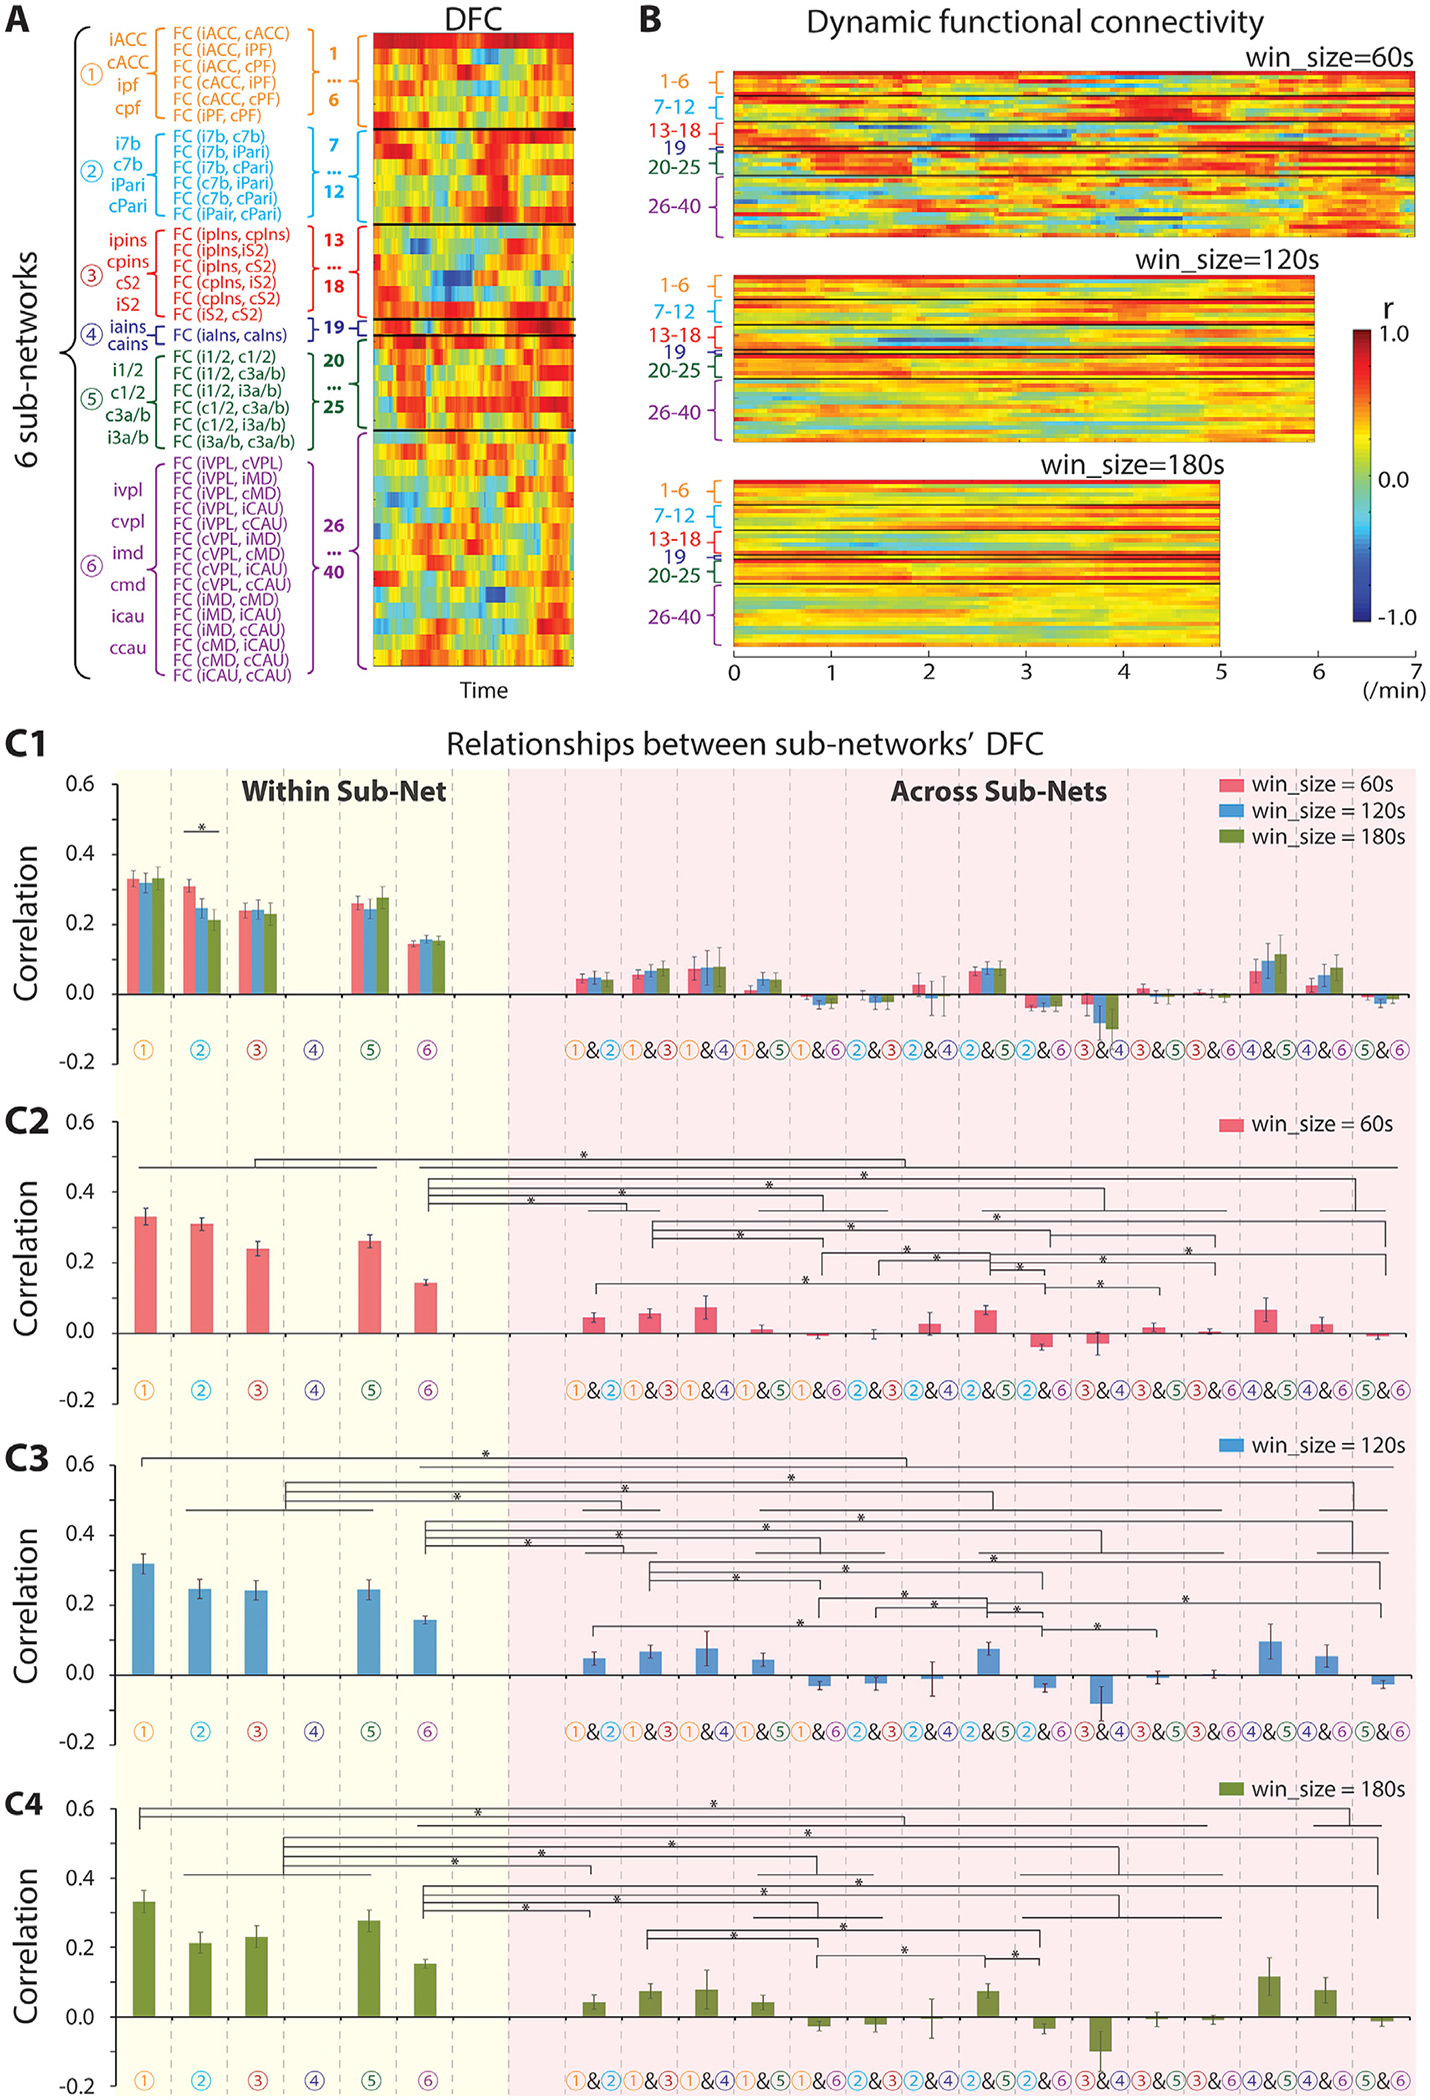
Fig. 4.

Temporal dynamic functional connectivity (DFC) features of six nociceptive sub-networks. (A) Scheme of DFC analysis across six sub-networks and a representative DFC example from one run of session 1 of SM-H. (B) Example of a DFC profile of the seed regions with sliding-window sizes of 60 s (top), 120 s (middle), and 180 s (bottom). (C1) DFC relationships within (yellow column) and across sub-networks (pink column). (C2-C4) DFC relationships within (yellow column) and across sub-networks (pink column) with sliding-window size of 60 s (C2), 120 s (C3), and 180 s (C4). The total number of DFC pairs within sub-network 1, 2, 3, or 5 is 210, and that from 6 is 1470. The number of DFC pairs across sub-networks 1 & 2, 1 & 3, 1 & 5, 2 & 3, 2 & 5, or 3 & 5 is 504, across sub-network 1 & 4, 2 & 4, 3 & 4, or 4 & 5 is 84, across sub-network 1 & 6, 2 & 6, 3 & 6, or 5 & 6 is 1260, and across sub-network 4 & 6 is 210. Sidak’s multiple comparisons test, *p < 0.05, Error bars indicate standard error.
