. 2022 Apr 20;28(14):3116–3126. doi: 10.1158/1078-0432.CCR-22-0421

Figure 1.

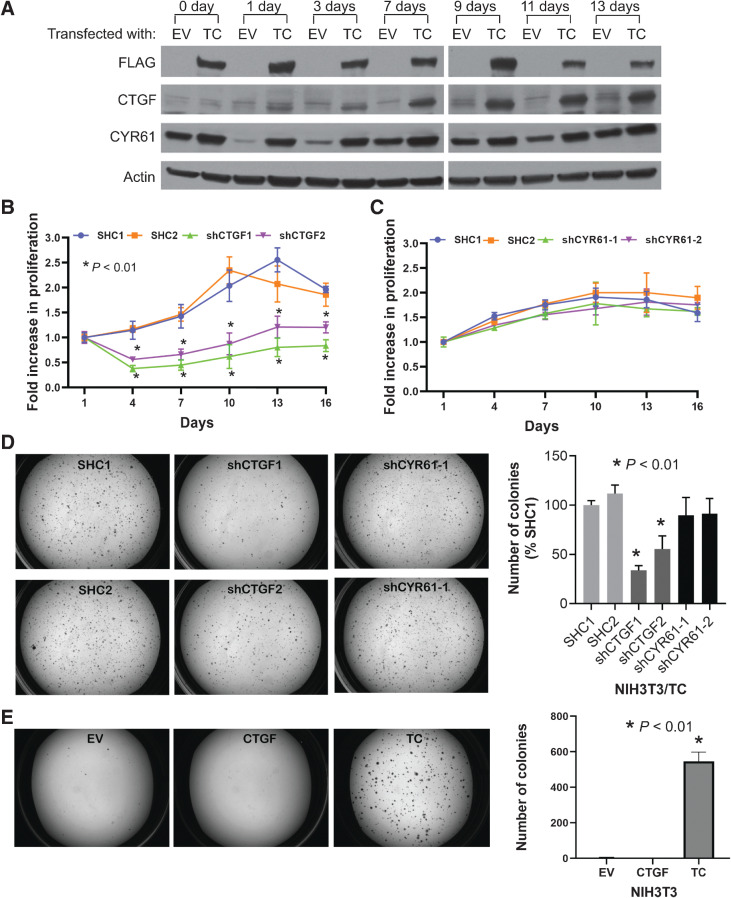
Figure 1. CTGF is a key downstream target of the TC fusion protein. A, Immunoblots to estimate the expression levels of CTGF and CYR61 in NIH3T3 cells transfected with either an EV or FLAG-TC fusion gene construct (TC). Cells were grown in suspension on HEMA-treated culture plates. Cell proliferation assay to measure the rate of anchorage-independent cell growth of NIH3T3/TC cells grown in suspension after the knockdown of CTGF (B) or CYR61 (C). D, Soft agar colonies of NIH3T3/TC cells expressing either control (SHC1/2), CTGF, or CYR61 shRNAs; quantification of the colony numbers is also shown. E, Soft agar assay to observe colony growth after CTGF overexpression. Data represent the mean ± SD of independent wells; experiments were performed at least twice.

CTGF is a key downstream target of the TC fusion protein. A, Immunoblots to estimate the expression levels of CTGF and CYR61 in NIH3T3 cells transfected with either an EV or FLAG-TC fusion gene construct (TC). Cells were grown in suspension on HEMA-treated culture plates. Cell proliferation assay to measure the rate of anchorage-independent cell growth of NIH3T3/TC cells grown in suspension after the knockdown of CTGF (B) or CYR61 (C). D, Soft agar colonies of NIH3T3/TC cells expressing either control (SHC1/2), CTGF, or CYR61 shRNAs; quantification of the colony numbers is also shown. E, Soft agar assay to observe colony growth after CTGF overexpression. Data represent the mean ± SD of independent wells; experiments were performed at least twice.