. 2022 Apr 20;28(14):3116–3126. doi: 10.1158/1078-0432.CCR-22-0421

Figure 6.

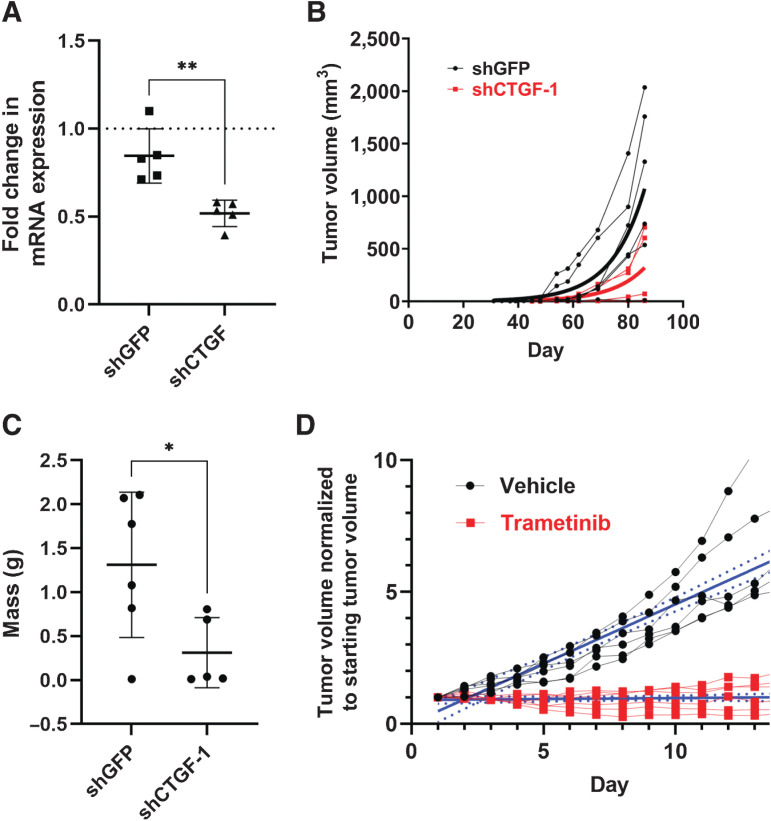
Figure 6. CTGF and MAPK signaling sustain tumor growth in vivo. NIH3T3/TC cells were infected with a control GFP shRNA or a shRNA targeting CTGF and assayed for A, Ctgf mRNA expression by qPCR; data are shown as mean ± SD, samples were normalized to control cells lacking any shRNA (dotted line; n = 5 samples run in triplicate from five independent experiments, **P < 0.01). B, Control or CTGF knockdown cells were injected subcutaneously in NSG mice, and tumor volume was measured twice per week for 85 days. C, Tumors from (B) were isolated and weighed; data are shown as mean ± SD (n = 6 shGFP mice and n = 5 shCTGF-1 mice, *P < 0.05 by unpaired t test). D, NIH3T3 cells stably expressing TAZ-CAMTA1 were injected subcutaneously and allowed to form tumors. Once tumors reach a volume of between 150 to 250 mm3 mice received daily oral treatment with either vehicle or 1 mg/kg trametinib for 14 days. Plots show individual mouse tumor volume normalized to tumor volume at the start of treatment (solid Iines with dots). Solid blue lines represent linear regression with 95% CI (dashed blue lines) shown (n = 6 mice per group); the difference in the slopes of the linear regression was tested by ANOVA; **** P < 0.0001.

CTGF and MAPK signaling sustain tumor growth in vivo. NIH3T3/TC cells were infected with a control GFP shRNA or a shRNA targeting CTGF and assayed for A,Ctgf mRNA expression by qPCR; data are shown as mean ± SD, samples were normalized to control cells lacking any shRNA (dotted line; n = 5 samples run in triplicate from five independent experiments, **P < 0.01). B, Control or CTGF knockdown cells were injected subcutaneously in NSG mice, and tumor volume was measured twice per week for 85 days. C, Tumors from (B) were isolated and weighed; data are shown as mean ± SD (n = 6 shGFP mice and n = 5 shCTGF-1 mice, *P < 0.05 by unpaired t test). D, NIH3T3 cells stably expressing TAZ-CAMTA1 were injected subcutaneously and allowed to form tumors. Once tumors reached a volume of between 150 to 250 mm3, mice received daily oral treatment with either vehicle or 1 mg/kg trametinib for 14 days. Plots show individual mouse tumor volume normalized to tumor volume at the start of treatment (solid Iines with dots). Solid blue lines represent linear regression with 95% CI (dashed blue lines) shown (n = 6 mice per group); the difference in the slopes of the linear regression was tested by ANOVA; **** P < 0.0001.