
Figure 2.
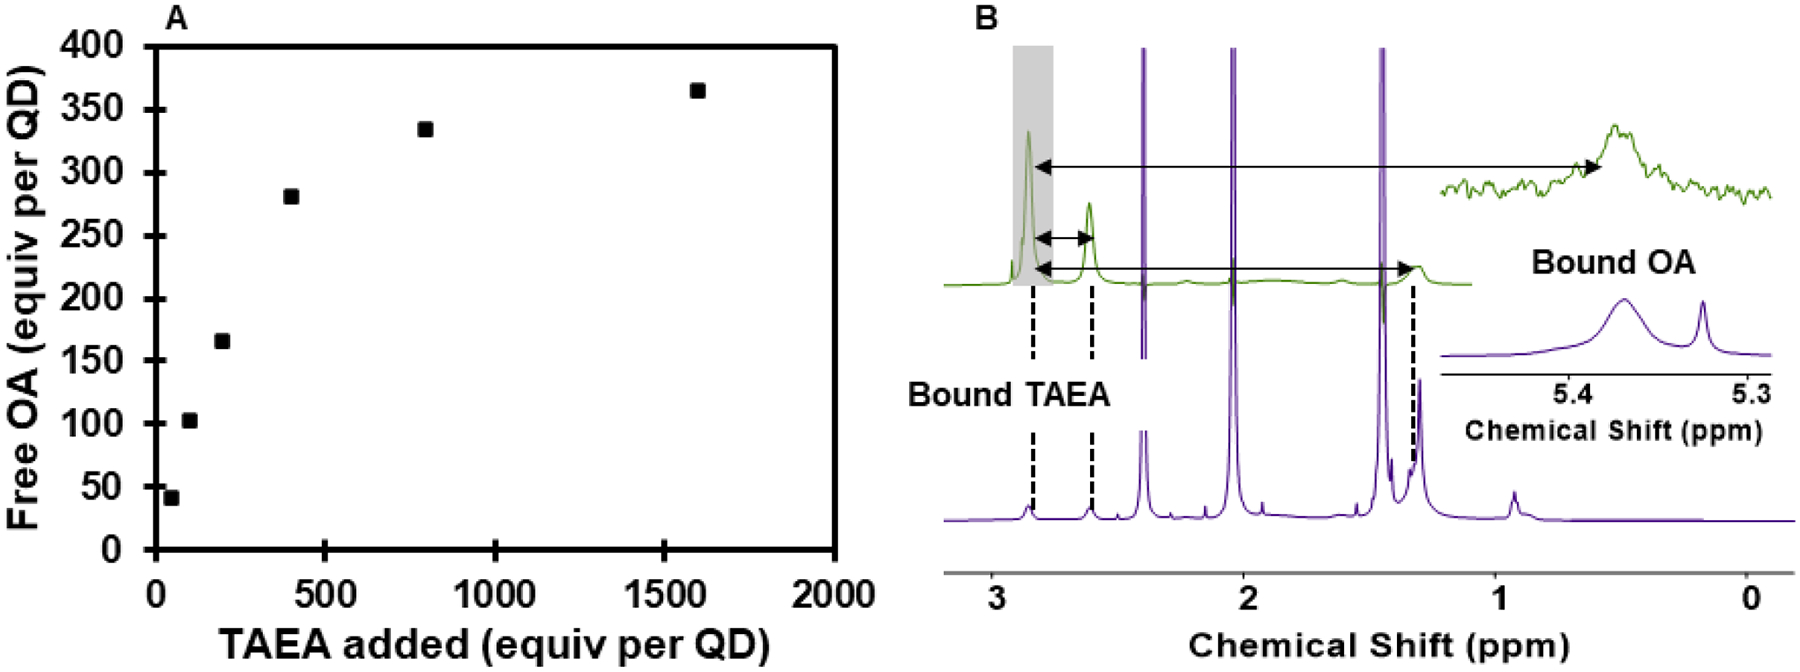
A. Displacement of OA from the surface of CdS QDs (6 × 10⁻⁶ mmol) after treatment with TAEA in toluene-d8. See Supporting Information Figure S3 for experimental details. B. Bottom spectrum (purple): 1H NMR spectrum of 6.0 nm CdS QDs (6 × 10⁻⁶ mmol) in CDCl3 after treatment with TAEA (6 × 10⁻² mmol) and subsequent purification. Additional peaks are residual solvent from the sample preparation procedure. Dashed lines are guides to the eye. Top spectrum (green): Selective 1D NOESY with the 180° pulse applied to the TAEA CH2 resonance at 2.86 ppm (shaded box). Black arrows indicate negative (same-phase) NOE between the pulsed resonance and other signals. Negative NOE is observed with other TAEA resonances and residual surface-bound OA resonances which remain after treatment with TAEA, confirming the presence of TAEA on the QD surface. See Supporting Information Figure S4 for experimental details.