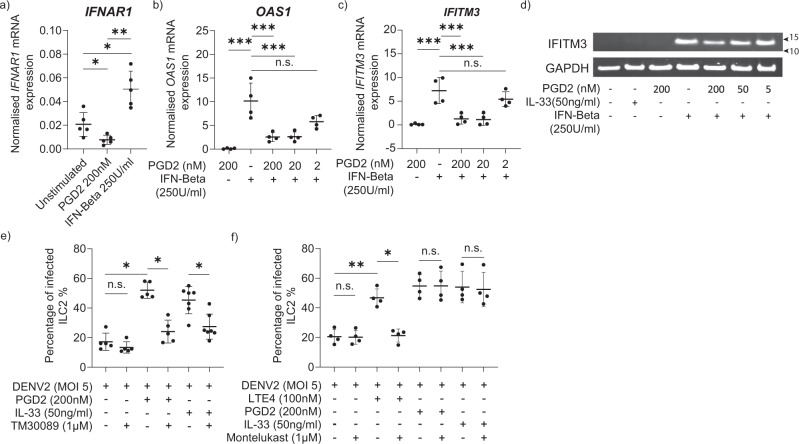
Fig. 4. ILC2 activation through PGD2 increased the infectivity of ILC2.
a Real-time PCR analysis of IFNAR1 gene expression by ILC2 following 2 h of stimulation with PGD2 (200 nM) and IFN-β (250 IU/ml). (n = 5, one-way ANOVA with Tukey’s multiple comparison test, data representative of three independent experiments. P * < 0.05, ** <0.01. Gene expression normalised to GAPDH. Real-time PCR analysis of b OAS1 and c IFITM3 gene expression by ILC2 following stimulation with PGD2 (2, 20, 200 nM) for 1 h and then treated with IFN-β (250 IU/ml). (n = 4, one-way ANOVA with Tukey’s comparison test, data representative of three independent experiments). Gene expression normalised to GAPDH. P *** < 0.001. d Western blot of IFITM3 protein expression of ILC2 treated with PGD2 (5–200 nM) and subsequently added IFN-β (250 IU/ml). Data representative of two independent experiments (Supplementary Fig. 9). e ILC2 were treated with CRTH2 antagonist (TM30089 – 1 µM) for 1 h before treatment with PGD2 (200 nM) or IL-33 (50 ng/ml) for 24 h. ILC2 were infected with DENV2 (MOI 5), and intracellular DENV E protein was assessed. Statistical significance was tested using one-way ANOVA with Tukey’s multiple comparison test, data representative of three independent experiments (n = 5–7). P * < 0.05, n.s. not significant. f ILC2 were treated with Montelukast (1 µM) for 1 h before treatment with PGD2 (200 nM), IL-33 (50 ng/ml), LTE4 (100 nM) for 24 h. ILC2 were infected with DENV2 (MOI 5), and intracellular DENV E protein was assessed. Statistical significance was tested using one-way ANOVA with Tukey’s multiple comparison test, data representative of 3 independent experiments (n = 4). P * < 0.05, ** <0.01, n.s. not significant. All error bars represent mean ± SD.

