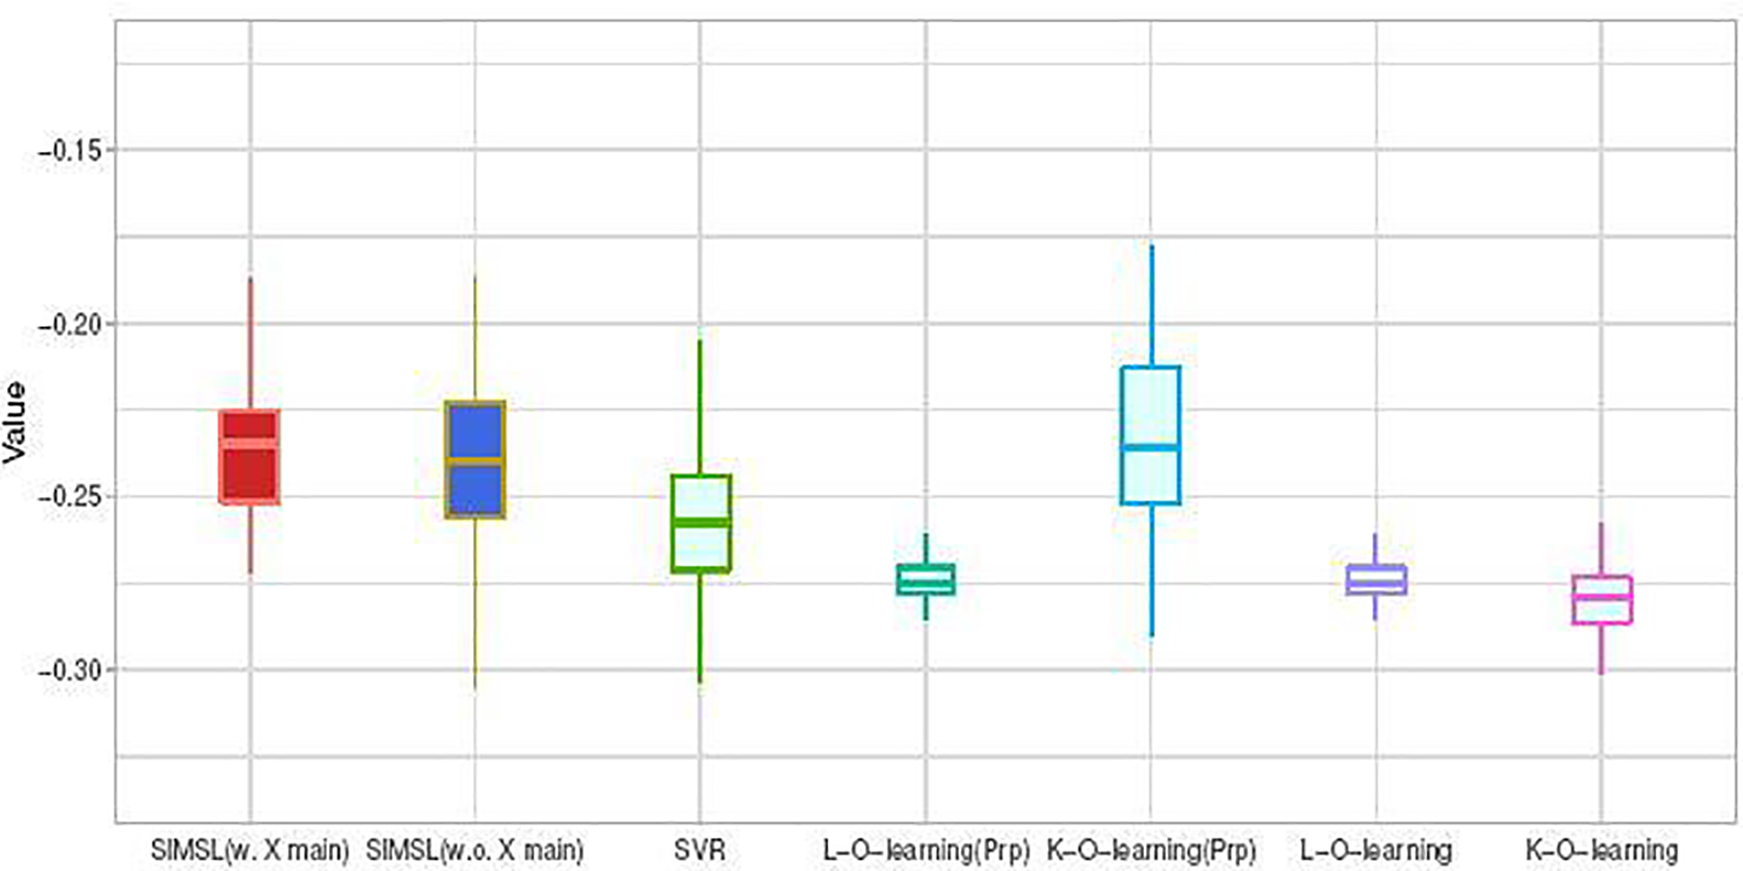
Fig. 2.

Boxplots of the estimated values of the individualized dose rules using 7 approaches, obtained from 100 randomly split testing sets. Mean (and standard deviation) of the value estimates: SIMSL(w. X main): −0.231 (0.03); SIMSL(w.o. X main): −0.237 (0.03); SVR: −0.254 (0.02); L-O-learning(Prp): −0.274 (0.01); K-O-learning(Prp): −0.234 (0.03); L-O-learning: −0.274 (0.01); K-O-learning: −0.279 (0.01).
