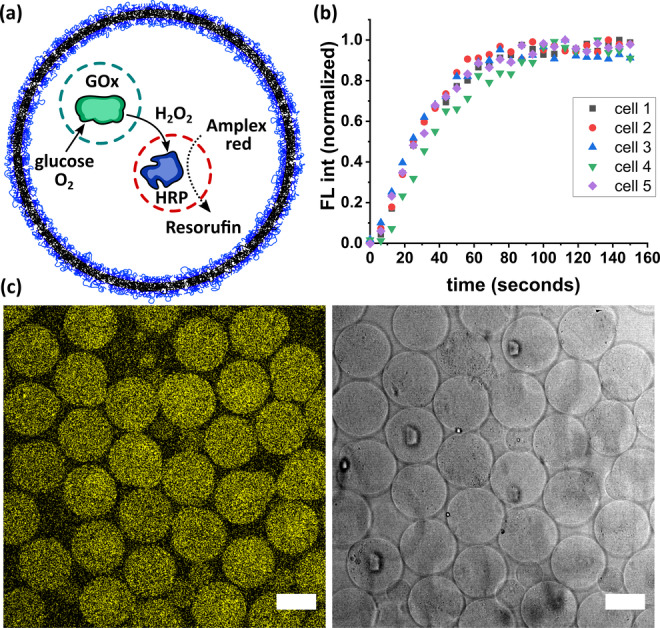
Figure 5.

Cascade reaction in a synthetic cell. a) Schematic illustration of the cascade reaction promoted by GOx@NR and HRP@NR in a synthetic cell. b) Fluorescence intensity of the product (resorufin) over time obtained by confocal microscopy for 5 individual synthetic cells. Time step size: 6.5 seconds. c) Confocal microscopy images of the reaction end points. Left: resorufin fluorescence. Right: bright field image. Scale bars=50 μm.
