
FIGURE 3.
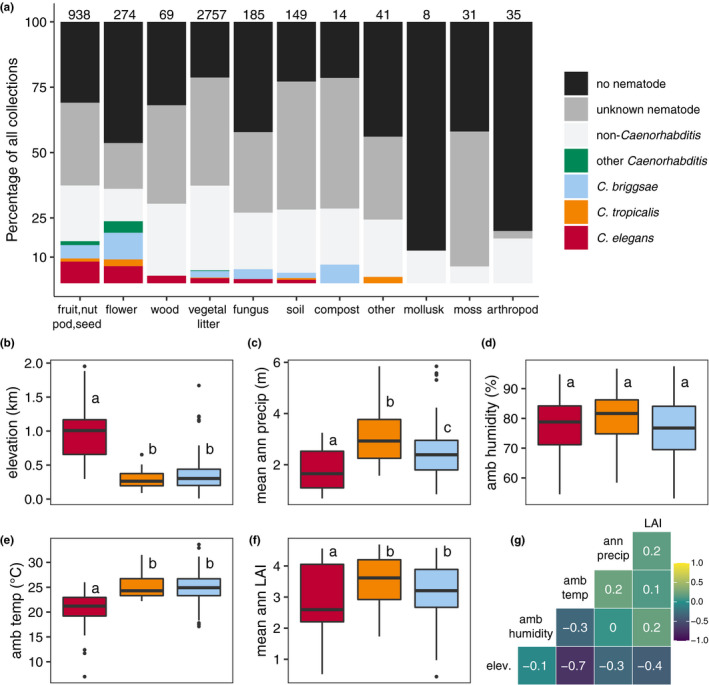
Niche differentiation among selfing Caenorhabditis nematodes. (a) The percentage of each sampling category is shown by substrate type. The sampling categories are coloured according to the legend on the right, and the total number of samples for each substrate are shown above the bars. (b–f) Environmental parameter values; elevation, mean annual precipitation, in situ ambient humidity, in situ ambient temperature, and mean annual leaf area index (LAI) for sites where Caenorhabditis species were isolated. Tukey's box plots are plotted by species (red is Caenorhabditis elegans, orange is C. tropicalis, blue is C. briggsae) for each environmental parameter; points above or below whiskers indicate outliers. Letters above the boxes summarize the statistical significance of comparisons between the species shown. Species with a different letter are significantly different; species with the same letter are not significantly different. Comparisons were made using a Kruskal‐Wallis test and Dunn's test for multiple comparisons with p‐values adjusted using the Bonferroni method. (g) A correlation matrix for the continuous environmental parameters shown. The parameter labels for the matrix are printed on the diagonal, and Pearson's correlation coefficients are printed in the cells. The colour scale also indicates the strength and sign of the correlations shown in the matrix