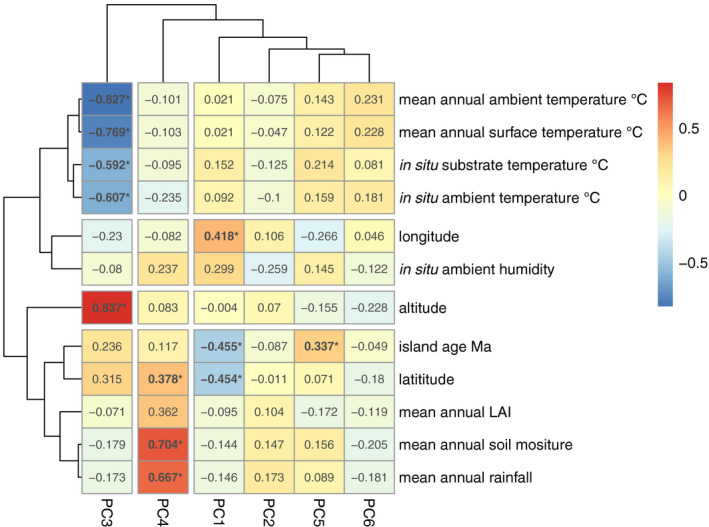
FIGURE 6.

PC and environmental parameter correlation heatmap. The six significant axes of genetic variation (PCs) from PCA on 149 non‐outlier Hawaiian isotypes are shown on the x‐axis (PCs 1–6), and continuous environmental parameters are plotted on the y‐axis. The cell values represent the Pearson's correlation coefficient between a given PC and environmental parameter values, bold values with an asterisk indicate a significant correlation. The cell colours correspond to the strength and direction of the correlation (see colour scale on the right)
