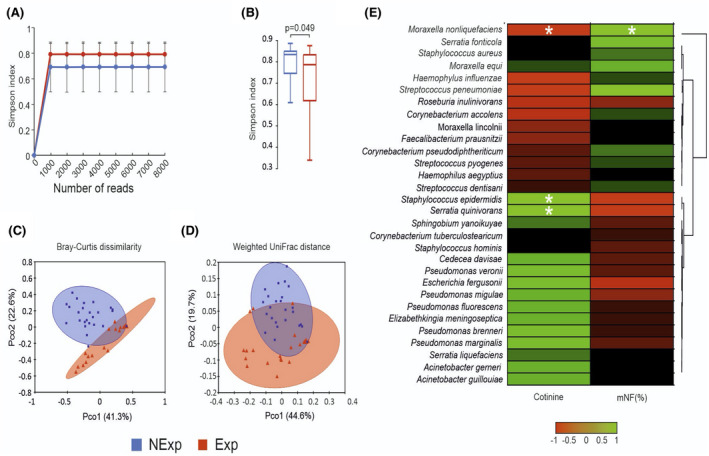
FIGURE 1.

Bioinformatic analysis of 16S metagenomic reads. A, Color‐coded rarefaction curves. For each group, the average values of α‐diversity indexes with 95% confidence intervals were reported at different sequencing depths. B, Box plots showing the Simpson index α‐diversity estimator, measured for each group. C,D, PCoA plot of bacterial β‐diversity based on Bray‐Curtis dissimilarity and weighted UniFrac distance according to exposure to secondhand smoke. For each group, the 95% confidence interval has been drawn. Numbers between parentheses represent the percentage of the total variance explained by the principal coordinates. Values are expressed as mean ±SD. E, Cross‐correlation heatmaps based on Spearman's correlation coefficients computed between the relative abundance of taxa ≥0.05% in at least one group and the values observed for mNF% and cotinine across the whole population of studied subjects. The color scale represents values assumed by Spearman's correlation coefficient (ρ) with green and red for positive and negative correlations. According to hierarchical simple‐linkage clustering, taxa were ordered based on Spearman's coefficients computed on relative abundances (dendrogram on the left). A white asterisk indicates a significant correlation at α level 0.05 after FDR correction for multiple comparisons
