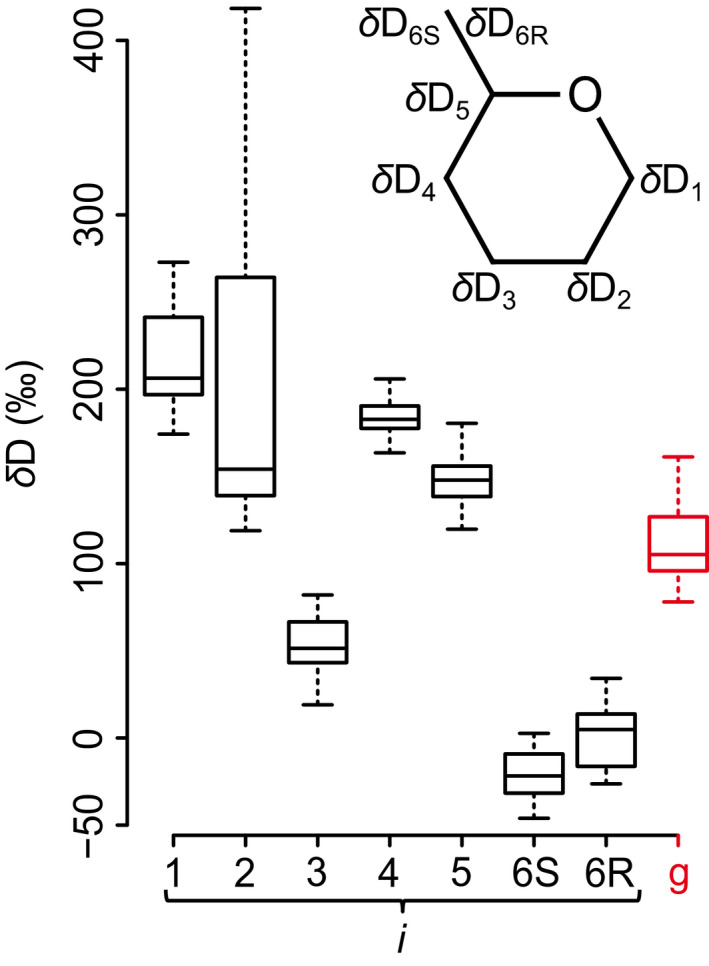
Fig. 1.

Variability in δD time series shown by boxplots. δD i and δDg denote time series of D abundance at intramolecular H‐C positions in tree‐ring glucose (black) and of the whole molecule (red), respectively. Data were acquired for tree‐ring glucose of Pinus nigra laid down from 1961 to 1995 at a site in the Vienna Basin (δD i : ±SE = 5.4‰, n ≥ 3; δDg: ±SE = 3.4‰, n ≥ 3). Outliers were removed before analysis (δD1 to δD3: n = 31; δD4 and δD5: n = 30; δD6S: n = 26; δD6R: n = 28; and δDg: n = 25). Data reference: Average D abundance of the methyl group hydrogens of the glucose derivative used for NMR measurements. Insert: glucose carbon skeleton showing intramolecular locations of δD i time series.
