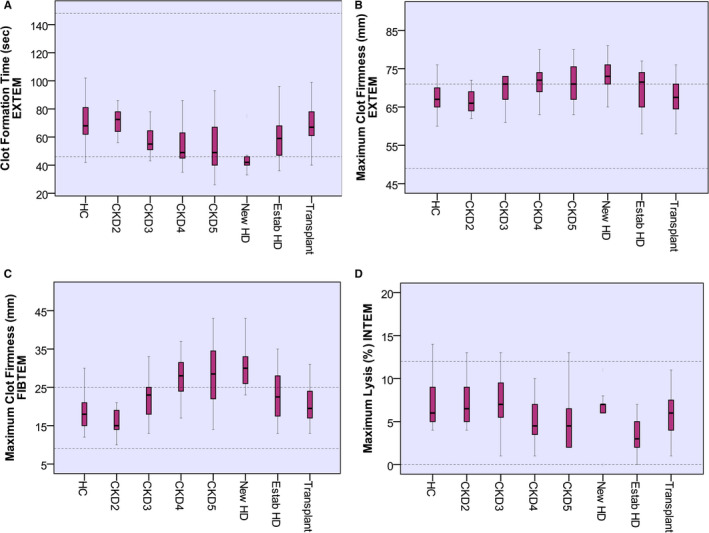
FIGURE 1.

Results of ROTEM parameters in different studied groups. Data are given as median and interquartile ranges. Clot formation time EXTEM (A) was shorter with progression of CKD, P < .01. Maximum clot firmness EXTEM (B) and Maximum clot firmness FIBTEM (C) were increasing with worsening of eGFR, P < .01. Maximum lysis INTEM (D) is lower with progression of CKD, P < .01. Dotted lines indicate normal range. CKD, chronic kidney disease; HC, healthy control; HD, hemodialysis; ROTEM, rotational thromboelastometry
