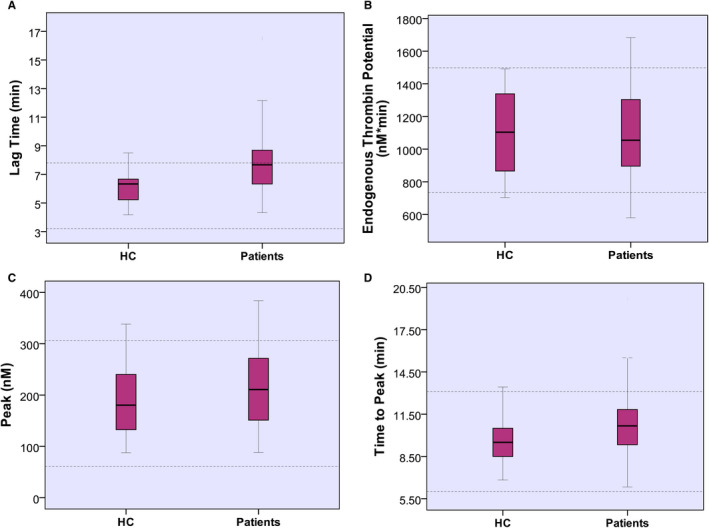
FIGURE 2.

Results of thrombin generation assays in healthy controls and chronic kidney disease patients. Lag time (A) was longer in patients than healthy controls, p < .001. Endogenous thrombin potential (B) and peak thrombin (C) are comparable between healthy controls and patients. Time to peak (D) is longer in patients than healthy controls, P < .01. Dotted lines indicate normal range
