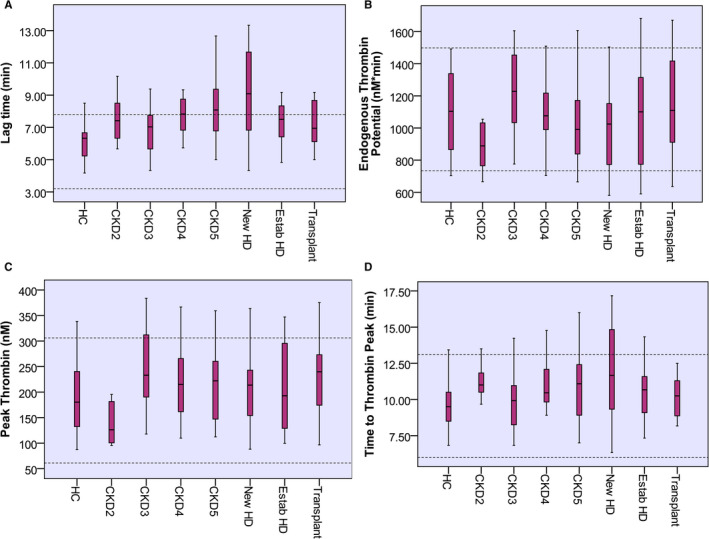
FIGURE 3.

Results of thrombin generation assays in different studied groups. Data are presented as median and interquartile ranges. Lag time (A), peak thrombin (C), and time to peak (D) were comparable between subgroups. Endogenous thrombin potential (B) was significantly different between patient subgroups P = .036. Dotted lines indicate normal range. CKD, chronic kidney disease; HC, healthy control; HD, hemodialysis
