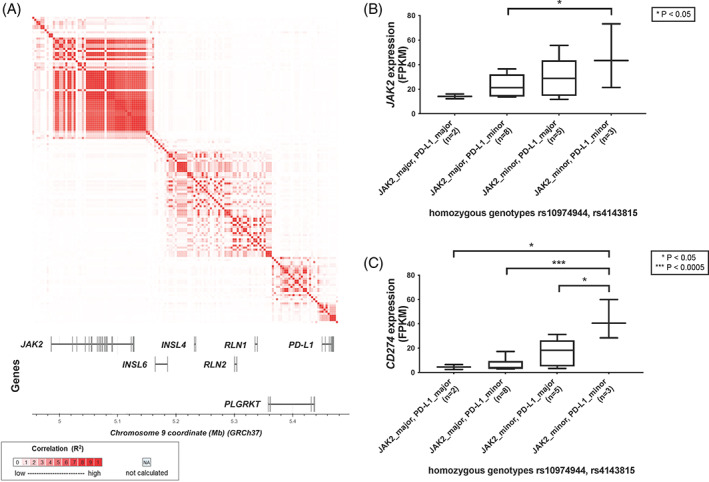
FIGURE 2.

Evaluation of germline genetic variation at the PD‐L1 locus. (A) Linkage analyses for the JAK2 and PD‐L1 loci suggest the lack of strong LD between the loci (pairwise LD metrics for rs10974944‐rs4143815: D′ = 0.1171, R2 = 0.0112), while low correlations are observed all across the region. (B,C) Expression of JAK2 (B) and PD‐L1 (C) in MPN patients (n = 18) homozygous for both rs10974944 (JAK2 locus) and rs4143815 (PD‐L1 locus). Significance levels as determined by unpaired t‐tests are shown if p < .05 [Color figure can be viewed at wileyonlinelibrary.com]
