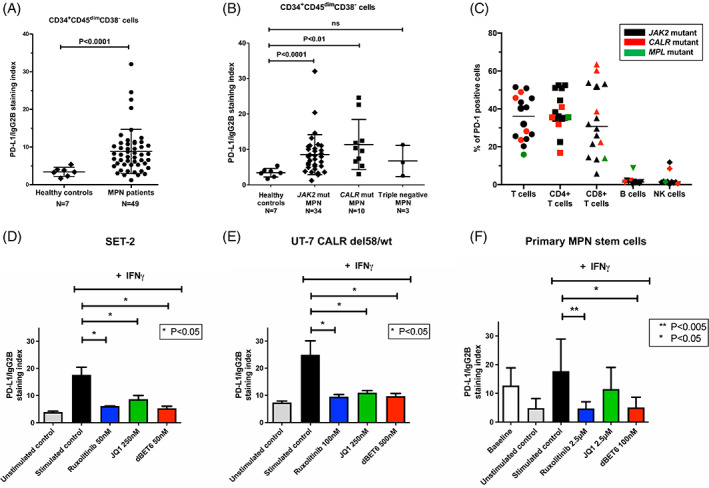
FIGURE 3.

PD‐L1 is upregulated on the surface of stem cells isolated from bone marrow samples of MPN patients and can be downregulated by ruxolitinib and dBET6. (A,B) PD‐L1 expression was assessed by multicolor flow cytometry on CD34+CD45dimCD38− putative neoplastic stem cells isolated from the bone marrow of MPN patients (N = 49) or healthy donors (N = 7). The horizontal line represents the mean ± standard deviation. (B) Both JAK2 and CALR mutant MPN patients showed an upregulation of PD‐L1 on stem cells when compared to healthy donors (p < .001 and p < .01, respectively). The horizontal line represents the mean ± standard deviation. (C) Expression of PD‐1 on T cells, B cells, and NK cells from fresh bone marrow samples of MPN patients was assessed using multicolor flow cytometry. The results are shown as percentage of PD‐1 positive cells and each datapoint represents one patient, while the horizontal line represents the median value. PD‐1 was expressed on both CD4+ and CD8+ T cells, but was not found to be expressed on B and NK cells of the majority of the samples analyzed. (D) SET‐2 and UT‐7 CALR del58/wt (E) cells were incubated with medium or medium containing 200 U/mL of IFN‐γ with or without indicated concentrations of ruxolitinib, JQ1, or dBET6. Drug concentrations were selected at IC20‐IC30 for each cell line. Expression of PD‐L1 was evaluated using flow cytometry upon 24 h of incubation. The expression of PD‐L1 is shown as the staining index, which represents the ratio of median fluorescence intensity of PD‐L1 and matched isotype control. The experiments were performed in triplicate and graphs represent mean ± standard deviation. (F) Primary MNC from six independent JAK2‐V617F positive MPN patients were incubated with medium or medium containing 200 U/mL of IFN‐γ with or without the indicated concentrations of ruxolitinib, JQ1, or dBET6 for 24 h. Upon incubation, PD‐L1 expression on CD34+CD45dimCD38− cells was evaluated using multicolor flow cytometry. The expression of PD‐L1 is shown as the staining index, which represents the ratio of median fluorescence intensity of PD‐L1 antibody and the isotype‐matched control antibody. The graph represents mean ± standard deviation of six independent experiments [Color figure can be viewed at wileyonlinelibrary.com]
