FIGURE 3.

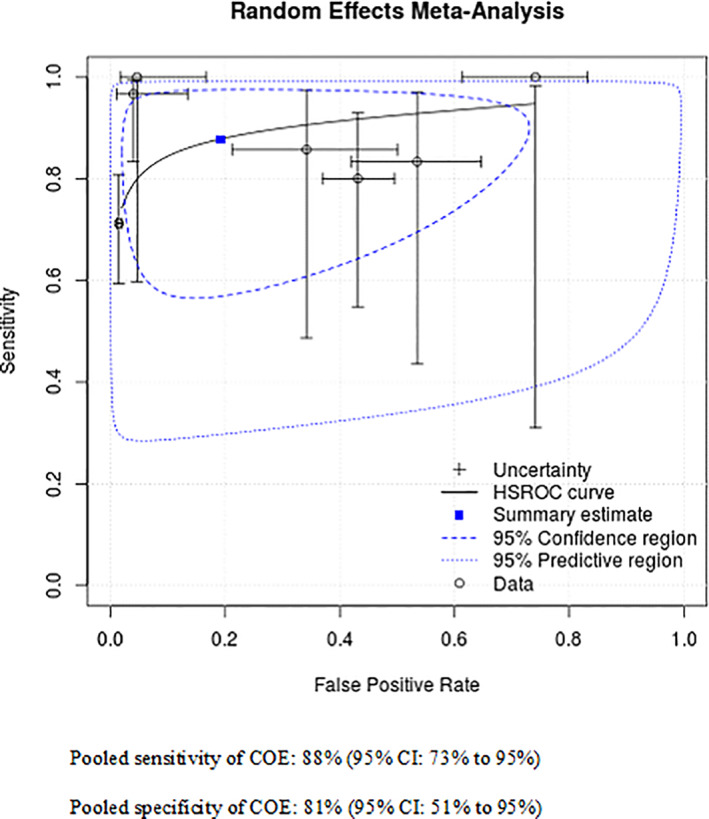
COE versus biopsy: Summary ROC curve for malignant lesions only (N = 7 studies) [Color figure can be viewed at wileyonlinelibrary.com]

COE versus biopsy: Summary ROC curve for malignant lesions only (N = 7 studies) [Color figure can be viewed at wileyonlinelibrary.com]