
FIGURE 1.
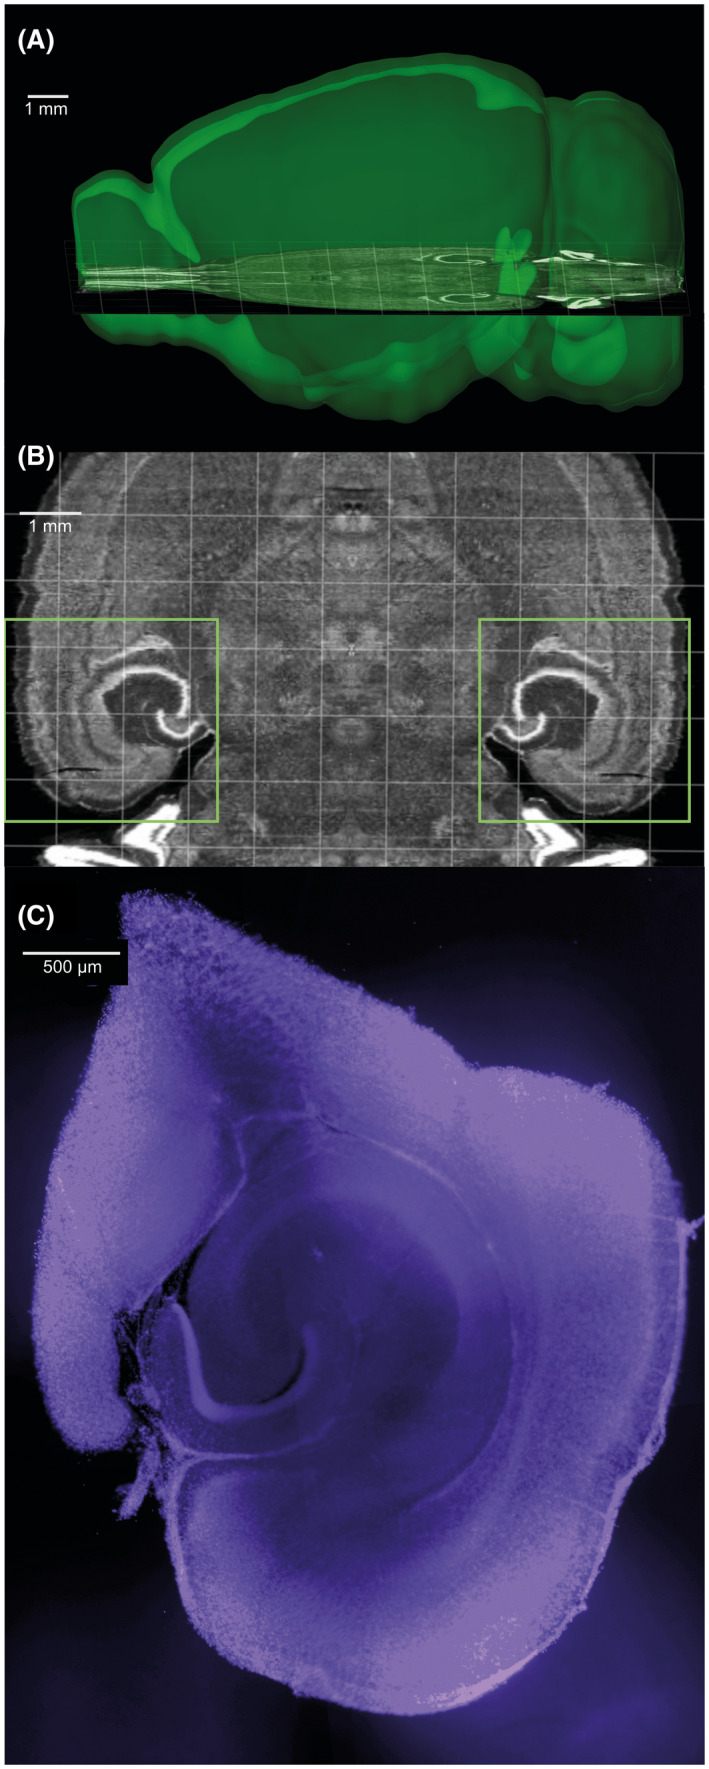
Images illustrating hippocampal slicing. (A and B) Approximate slicing location, according to the Allen Mouse Brain Atlas. Squares in B indicate the area of the slices kept. Images generated with the Allen Institute Brain Explorer 2 software, using the Allen Mouse Brain Atlas. (C) Example of slice section after electrophysiology (DAPI staining in blue)