
FIGURE 2.
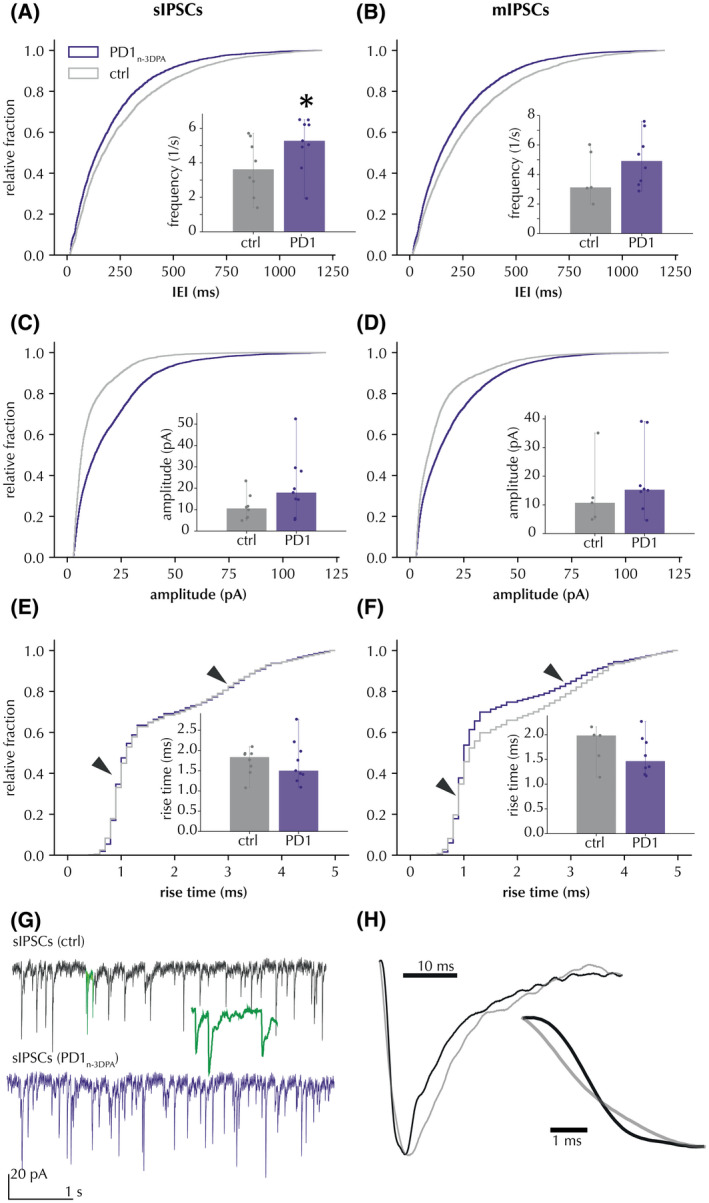
PD1n‐3DPA incubation increases the frequency and amplitude of IPSCs recorded in CA1 pyramidal neurons. (A) sIPSC interevent interval (IEI) presented as cumulative probability curves (Kolmogorov‐Smirnov test D = .098, p < .01) and cell‐based averages (insert) of sIPSC frequency. (B) mIPSCs, same presentation as (A), IEI (Kolmogorov‐Smirnov test D = .102, p < .01) and average frequencies. (C and D) sIPSC and mIPSC amplitudes, respectively, presented as cumulative probability curves (Kolmogorov‐Smirnov test sIPSCS: D = .272, p < .01; mIPSCs: D = .181, p < .01) and cell‐based averages (insert). (E and F) Rise‐times of sIPSCs and mIPSCs, respectively, presented as cumulative probability curves (Kolmogorov‐Smirnov test sIPSCS: D = .029, p > .01; mIPSCs: D = .101, p < .01) and cell‐based averages (inserts). Arrows denote 2 distinct distribution peaks around 1 and 3 ms. Insets display the median and range of cell averages. * Mann‐Whitney p < .05 for cell averages. (G) representative traces of sIPSCs with and without PD1n‐3DPA. Highlighted segment (green) shows 10‐fold time‐stretched recording. (H) magnification of amplitude‐normalized averaged fast (black) and slow (grey) rise‐time events in cells from control slices (n = 125 sIPSCs per group)