
FIGURE 3.
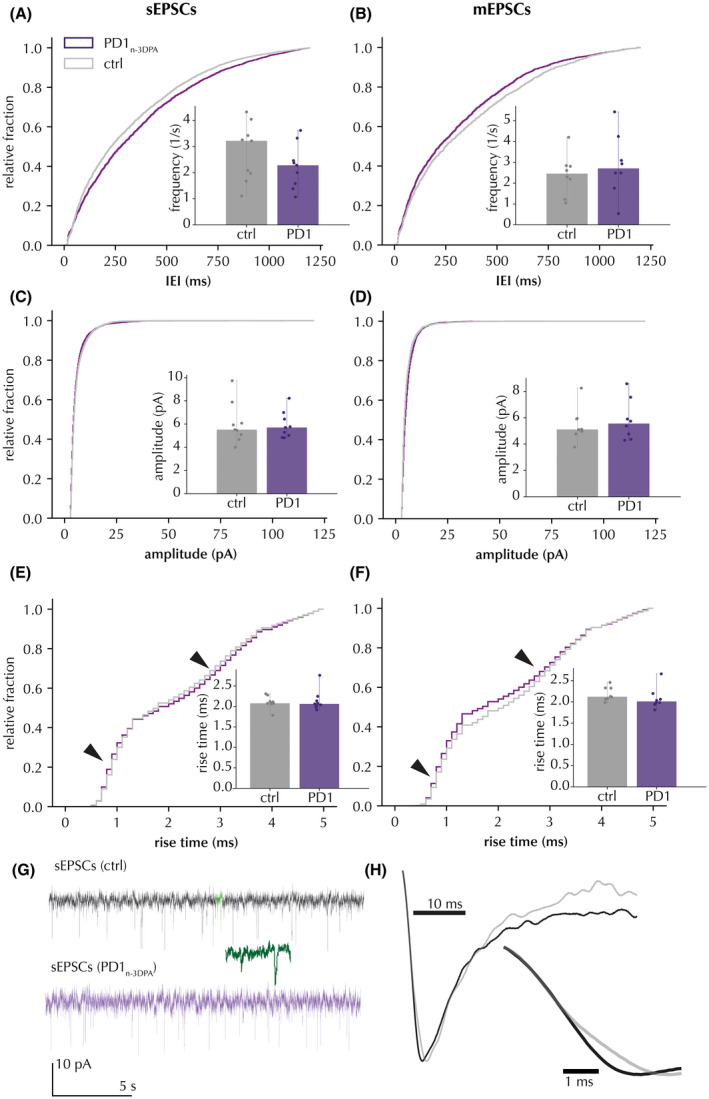
Effect of PD1n‐3DPA incubation on EPSCs recorded in CA1 pyramidal neurons. (A and B) sEPSCs and mEPSCs, respectively, are presented as cumulative probability curves for IEI (sEPSCs: Kolmogorov‐Smirnov test D = .014, p < .01; mEPSCs: D = .045, p < .01) and cell‐based averages for sEPSC frequencies (inserts). (C and D) sEPSCs and mEPSCs, respectively, are presented as cumulative probability curves (sEPSCs: Kolmogorov‐Smirnov test D = .045, p < .01; mEPSCs: D = .089, p < .01) for amplitudes and cell‐based averages (inserts). (E and F) sEPSC and mEPSC rise‐times, respectively, are presented as cumulative probability curves (sEPSCs: Kolmogorov‐Smirnov test D = .028, p > .01; mEPSCs: D = .062, p < .01) and cell‐based averages. Insets display the median and range of cell average. Arrows denote much less pronounced peaks as compared to those in Figure 1. (G) representative traces with and without PD1n‐3DPA. Highlighted segment (green) shows 10‐fold time‐stretched recording. (H) magnification of amplitude‐normalized averaged fast (black) and slow (grey) rise‐time events in cells from control slices (n = 42 sEPSCs per group)