
FIGURE 5.
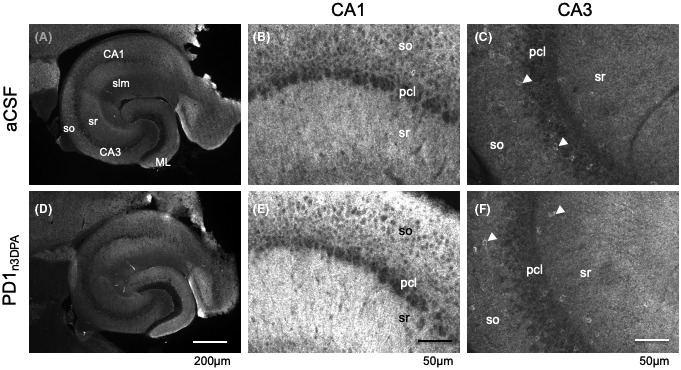
Examples of slices and the subfields CA1 and CA3 examined by immunofluorescence for GABAA receptor γ2‐subunit. Panels A and C show immunofluorescence images of representative slices incubated with aCSF (A) or PD1n3DPA in aCSF (D). Panels B and E show respective details of Sector CA1 and panels C and F of sector CA3 of the same sections. GABAA receptor γ2‐immunofluorescence labels primarily dendrites (note punctate labeling in B and E). Pericarya of pyramidal cells and interneurons are mostly unlabeled and appear dark. Note that in CA3 some interneurons show immunoreactivity at their cell bodies (arrow heads). Panel E indicates somewhat more intensive labeling for the γ2‐subunit as observed in some sections. CA1, CA3, cornu ammonis, sectors 1 and 3; ML, dentate molecular layer; pcl, pyramidal cell layer; slm, stratum lacunosum moleculare; so, stratum oriens; sr, stratum radiatum