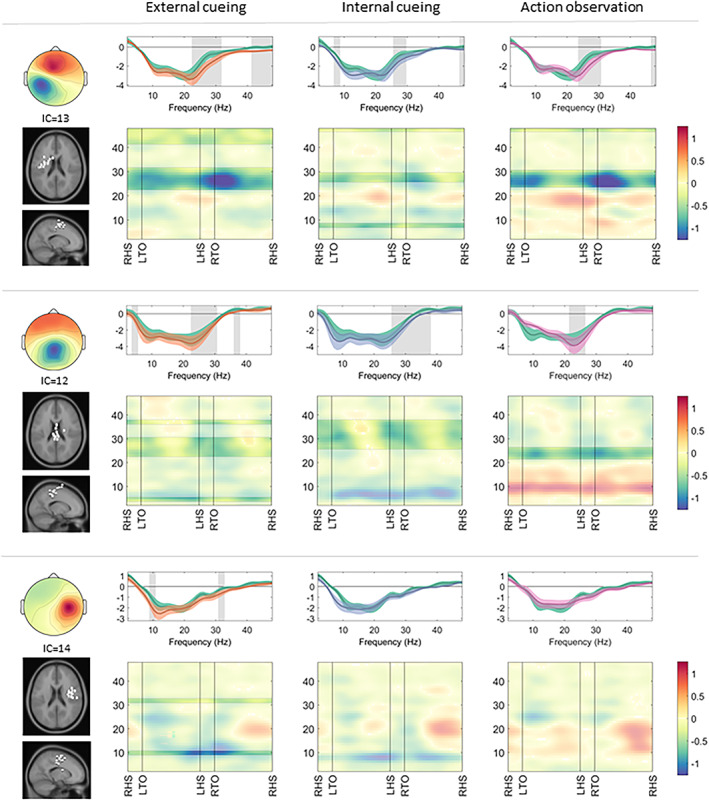
FIGURE 2.

Somatosensory clusters: cortical activation during gait with a compensation strategy. Cortical activation spectra (top rows) show power changes during gait conditions relative to stance conditions (mean ± standard error), and cortical activation time‐frequency maps (bottom rows) illustrate relative differences (compensation strategy gait minus uncued gait) across the gait cycle. The negative values around sensorimotor alpha (8–12Hz) and beta (13–35Hz) frequency bands indicate increased cortical activation during gait (top row, all conditions). Similarly, negative values around the beta frequency band (bottom row, all conditions) indicate stronger cortical activation during application of the compensation strategies. Significant effects (p < 0.05) of a given compensation strategy (external cueing: orange; internal cueing: blue; action observation: pink) in contrast to uncued gait (green) are highlighted (spectra: gray background; maps: unmasked colors). IC = independent component; LHS = left heel strike; LTO = left toe off; RHS = right heel strike; RTO = right toe off.
