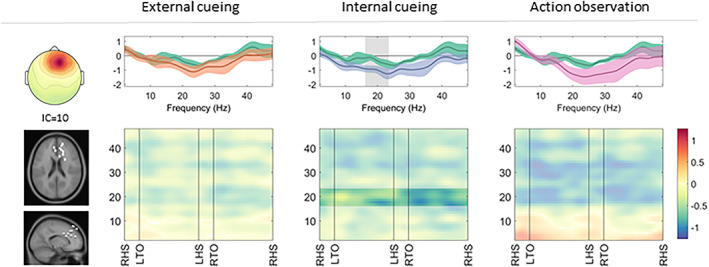
FIGURE 3.

Frontal cluster: cortical activation during gait with a compensation strategy. Cortical activation spectra (top row) show power changes during gait conditions relative to stance conditions (mean ± standard error), and cortical activation time‐frequency maps (bottom row) illustrate relative differences (compensation strategy gait minus uncued gait) across the gait cycle. Significant effects (p < 0.05) of a given compensation strategy (external cueing: orange; internal cueing: blue; action observation: pink) in contrast to uncued gait (green) are highlighted (spectra: gray background; maps: unmasked colors). IC = independent component; LHS = left heel strike; LTO = left toe off; RHS = right heel strike; RTO = right toe off.
