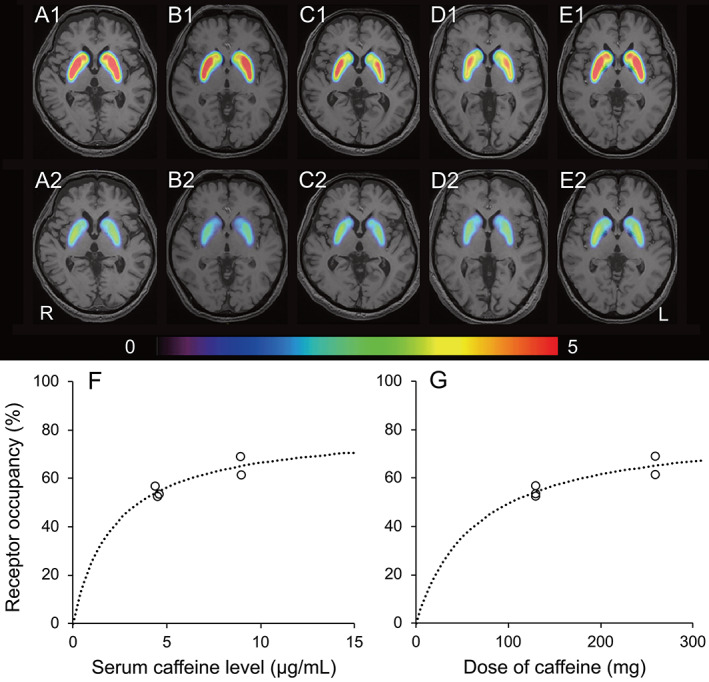
FIG 1.

Changes in binding potential (BPND) maps after caffeine intake in five patients with Parkinson's disease (A–E) and the relationships between adenosine A2A receptor occupancy and serum caffeine levels (F) or caffeine dose (G). BPND maps of adenosine A2A availability in patients 1 (A), 2 (B), 3 (C), 4 (D), and 5 (E) are displayed on structural magnetic resonance imaging as follows: at baseline (A1, B1, C1, D1, and E1) and after intake of coffee containing 259 mg (A2 and B2) or 129.5 mg (C2, D2, and E1) of caffeine. The rainbow‐colored scale represents the magnitude of BPND values. Patients 1–5 correspond to the numbers of the five patients in Table 1. The dashed curve was modeled using the following equation: occupancy (%) = α × [D/(D + ED50)], where α refers to the maximal receptor occupancy, D refers to serum caffeine levels (F) or caffeine dose (G), and ED50 refers to the level resulting in 50% of maximal receptor occupancy. L, left; R, right. [Color figure can be viewed at wileyonlinelibrary.com]
