
FIGURE 1.
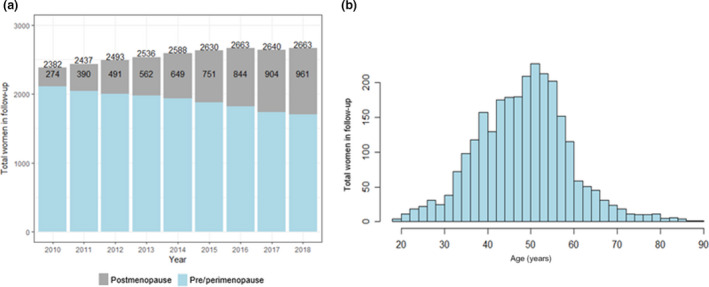
Demographic shift of women participating in the Swiss HIV Cohort Study (SHCS) between 2010 and 2018. (a) Proportion of postmenopausal women over time. (b) Age histogram of women participating in the SHCS in 2018
Official websites use .gov
A
.gov website belongs to an official
government organization in the United States.
Secure .gov websites use HTTPS
A lock (
) or https:// means you've safely
connected to the .gov website. Share sensitive
information only on official, secure websites.
Demographic shift of women participating in the Swiss HIV Cohort Study (SHCS) between 2010 and 2018. (a) Proportion of postmenopausal women over time. (b) Age histogram of women participating in the SHCS in 2018