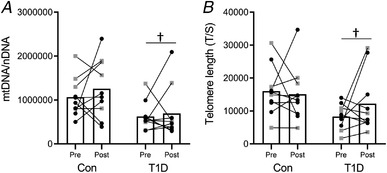
Figure 3. Markers of ageing.

Muscle content of mitochondrial DNA (mtDNA) (A) and telomere length (B) measured by real‐time PCR. The ratio of mitochondrial MT‐CO1 to nuclear 36B4 gene (nDNA) was used to quantify the mtDNA content. The ratio of telomeric repeats copy number (T) to a single copy (36B4) reference gene (S) was used to quantify the telomere length. All the panels show the pre‐ and post‐training measurements for the control group (Con) and for participants with type 1 diabetes (T1D) (female: black circles; male: grey squares). †P < 0.05, compared to control.
