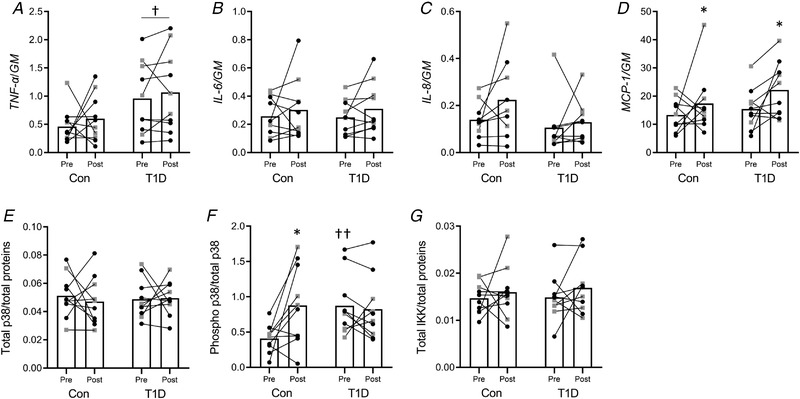
Figure 4. Markers of inflammation.

A–D, muscle mRNA expression levels of TNF‐ɑ (A), IL‐6 (B), IL‐8 (C) and MCP‐1 (D) measured by real‐time PCR. The geometric mean (GM) of GAPDH and B2M mRNA levels was used as the internal reference. E and F, plot of the densitometric analyses of total (E) and phosphorylated (F) p38 respectively normalised to total proteins and total p38. G, plot of total IKKβ normalised to total proteins. All the panels show the pre‐ and post‐exercise measurement for the control group (Con) and for participants with type 1 diabetes (T1D) (female: black circles; male: grey squares). * P < 0.05, compared to Pre; †P < 0.05, ††P < 0.01, compared to control.
