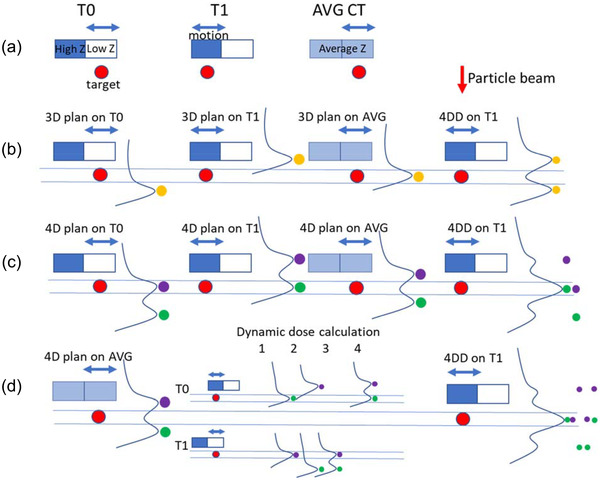
FIGURE 1.

Dosimetric impact of motion on particle beam. (a) A two‐phase respiratory motion model, where the target did not move, but the high‐Z (bone) structure moved in and out of a single particle beam. The average image (AVG) was generated by taking the pixel‐by‐pixel average of the two phases (T0 and T1). (b) 3D plan that was created using AVG, where a single spot (yellow) was used. The dose distribution for the same plan was then recalculated on both T0 and T1. The 4DD was then calculated by deforming dose distributions onto T1, and taking the average of all deformed doses. (c) 4D plan was created using both T0 and T1, where two spots (purple and green) with different energies were used to ensure coverage on both phases. The dose was then recalculated on AVG, and 4DD was also calculated. (d) Dynamic dose calculation for the 4D plan was simulated. For two spots and two phases, there were four possible dynamic delivery scenarios. Assuming the two spots were delivered independently and to each phase with equal chance, the weighted average of the four possible scenarios yielded the same result as 4DD
