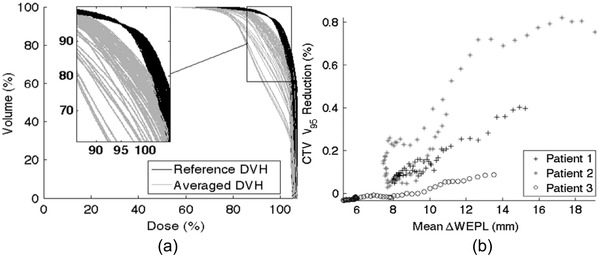
FIGURE 2.

(a) Reference MIP DVH (black) and phase averaged 4DCT DVH (grey) for the ITV for 61 single‐beam plans for patient 1. The plans were normalized to obtain V95 = 95%, as can be seen in the zoom region, where all reference DVH cross this point. Doses and volumes are given as a percentage of the total. (b) Scatter plot for patients 1 to 3 showing the strong association for each patient between the V95 reduction with the mean ΔWEPL. The values for the linear correlation coefficients are 0.98, 0.92, and 0.96 for patients 1, 2 and 3, respectively (p < 0.01). ([a] Figure 1 and [b] Figure 5 from Oscar Casares‐Magaz et al., A method for selection of beam angles robust to intrafractional motion in proton therapy of lung cancer. Acta. Oncol. 2014;53(8):1058–1063. Note that the (%) reduction in (b) appears to be decimal)
