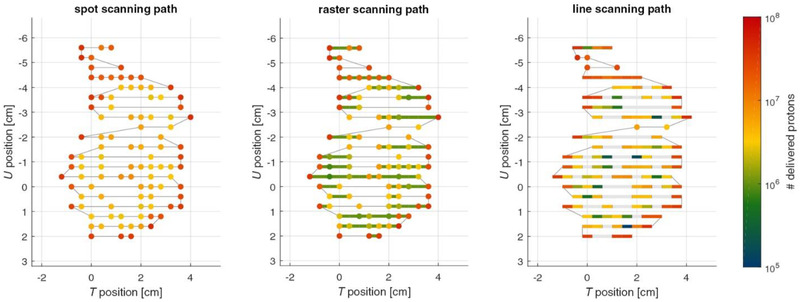
FIGURE 4.

Illustration of the scan path within an energy layer for the three scanned particle delivery techniques: spot scanning, raster scanning, and line scanning (from left to right). Axes T and U span the energy iso‐layer plane. Klimpki et al. Phys. Med. Biol. 2018;63:145006. https://doi.org/10.1088/1361‐6560/aacd27
