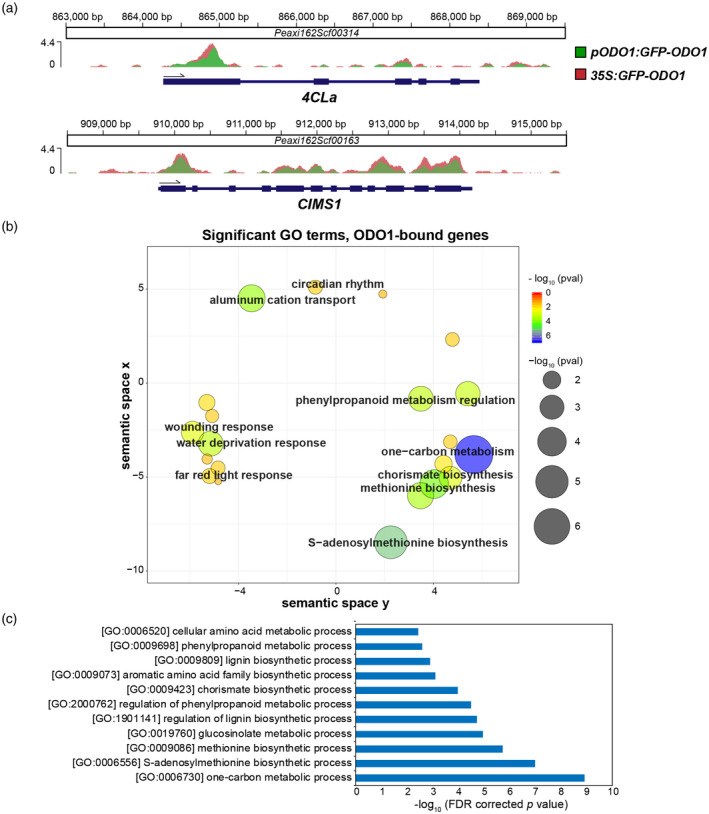
Figure 2.

ODO1‐bound genes determined by ChIP‐seq. (a) ChIP‐seq signals at two exemplary gene loci with detected ODO1 binding. The Y axis represents the sequencing depth covered by ChIP‐seq in fragments per million, after normalization to the total number of unique aligned fragments in each library. Ruler markings indicate location of ChIP signal along the corresponding petunia scaffolds, with annotated gene features below (thicker bar sections for coding regions, thinner sections for introns and untranslated regions). (b) ReviGO plot showing enriched GO terms among ODO1‐bound genes. Significantly enriched GO terms were determined among ODO1‐bound genes against P. axillaris background (FDR < 0.05), and then visualized by ReviGO to reduce the redundancy within the list of identified GO terms. In the ReviGO plot, significant GO terms are shown as circles in a two‐dimensional space, which was derived by multidimensional scaling of a semantic similarity matrix of the GO terms. Therefore, similar GO terms are close to each other in the RevoGO plot. Size and color of the circles represent the significance of enrichment measured as ‐log10(FDR corrected p value). (c) Metabolic GO terms significantly enriched among ODO1‐bound genes are shown and sorted in order of significance. Abbreviations: 4CL, 4‐coumaryl‐CoA ligase; CIMS, cobalamin‐independent methionine synthase; ODO1, ODORANT1.
