Figure 4.

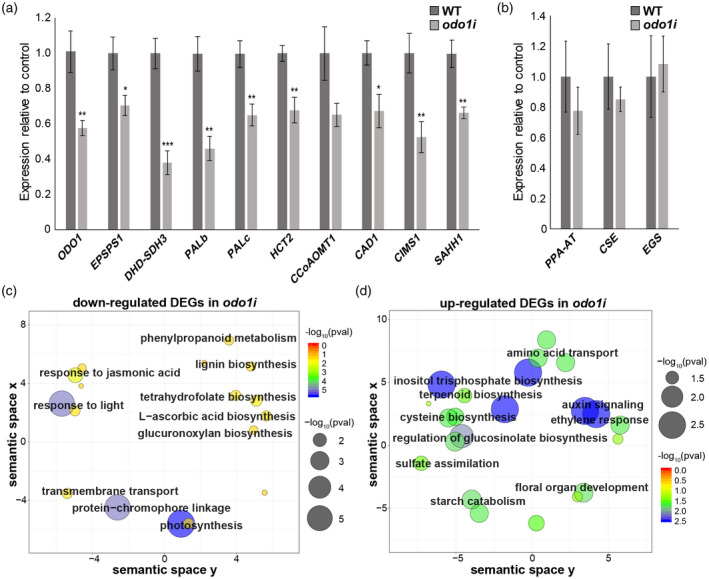
ODO1‐regulated genes. (a) Expression levels of selected ODO1‐bound genes in WT and ODO1 RNAi (odo1i) flowers measured by qRT‐PCR. Expression was normalized to the petunia housekeeping reference gene EF1a (Mallona et al., 2010). Error bars represent standard error of the mean for biological replicates (n = 6). Asterisks denote significance of difference in measurement between WT and odo1i as determined by Student’s t test: (*), P < 0.05, (**), P < 0.01, (***), P < 0.001. (b) Expression levels of volatile biosynthesis genes in WT and odo1i which are not predicted ODO1 binding targets, normalized to EF1a. Error bars represent standard error of the mean for biological replicates (n = 3). (c–d) ReviGO plots showing GO terms significantly enriched among differentially expressed genes (DEGs) downregulated (c) or upregulated (d) in odo1i compared to wild‐type determined by RNA‐seq. In the ReviGO plot, significant GO terms are shown as circles in a two‐dimensional space, which was derived by multidimensional scaling of a semantic similarity matrix of the GO terms. Size and color of the circles represent the significance of enrichment measured as ‐log10(FDR corrected p value). Abbreviations: CAD, cinnamyl alcohol dehydrogenase; CCoAOMT, caffeoyl‐CoA O‐methyltransferase; CIMS, cobalamin‐independent methionine synthase; CSE, caffeoyl shikimate esterase; DHD‐SDH, 3‐dehydroquinate dehydratase and shikimate dehydrogenase; EGS, eugenol synthase; EPSPS, 5‐enolpyruvylshikimate 3‐phosphate; HCT, hydroxycinnamoyl‐CoA:shikimate/quinate hydroxycinnamoyl transferase; ODO1, ODORANT1; PAL, phenylalanine ammonia lyase; PPA‐AT, prephenate aminotransferase; SAHH, S‐adenosyl‐L‐homocysteine hydrolase.
