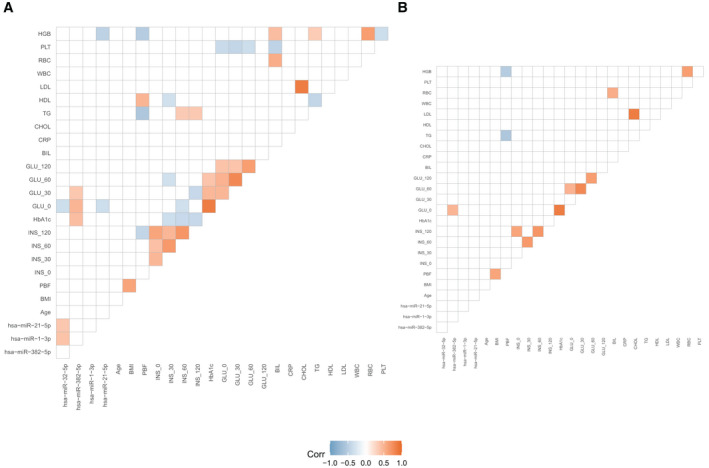
FIGURE 3.

Significant Pearson correlations between selected miRNA and clinical variables. The analysis was done using R packages Hmisc and ggcorrplot. Nonsignificant correlations based on (A) p < 0.05 and (B) adjusted p < 0.05 are set to blank. Red boxes indicate positive correlations, whereas blue boxes represent negative correlations. BIL, bilirubin levels; CHOL, cholesterol levels; CRP, C‐reactive protein levels; GLU_0, fasting blood glucose levels; GLU_30, plasma glucose levels measured at 30 minutes during OGTT; GLU_60, plasma glucose levels measured at 60 minutes during OGTT; GLU_120, Plasma glucose levels measured at 120 minutes during OGTT; HbA1c, hemoglobin A1c; HDL, high‐density lipoprotein levels; HGB, hemoglobin cell count; INS_0, fasting blood insulin levels; INS_30, plasma insulin levels measured at 30 minutes during OGTT; INS_60, plasma insulin levels measured at 60 minutes during OGTT; INS_120, plasma insulin levels measured at 120 minutes during OGTT; LDL, low‐density lipoprotein levels; miRNA, microRNA; OGTT, oral glucose tolerance test; PBF, percentage of body fat; PLT, platelet blood count; RBC, red blood cell count; TG, triglyceride levels; WBC, white blood cell count
