Figure 4.
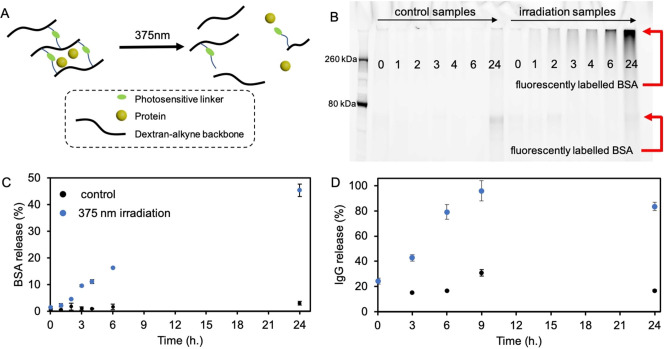
A) Schematic representation of a dextran‐based protein loaded hydrogel, which shows light triggered protein release. B) Fluorescent SDS‐page gel analysis of aliquots collected during 375 nm light irradiation experiments of BSA loaded C2 crosslinked hydrogel patches. The collected aliquots where incubated with NHS−Cy5 fluorophore prior to SDS‐page gel analysis. Fluorescent intensity of the entire lane was analyzed. Control samples show no fluorescent signal except the 24‐hour timepoint which shows low intensity fluorescence. An increase in fluorescence is observed over a time span of 24 h. C) 375 nm light triggered release of BSA from C2 crosslinked hydrogel patches. BSA concentration was determined by UV/Vis analysis (NanoDrop). Initial BSA hydrogel loading=1.8 μg/mL, maximal detected BSA concentration after 24 h of light irradiation=0.8 μg/mL (45 % release efficiency). SD determined by n=2 experiments. D) 375 nm light triggered release of IgG from C2 crosslinked hydrogel patches. IgG concentration was determined by a Bradford assay. Initial IgG hydrogel loading=0.5 mg/mL, maximal detected IgG concentration after 9 h of light irradiation=0.48 mg/mL (96 % release efficiency). SD determined by n=2 experiments.

