FIGURE 2.

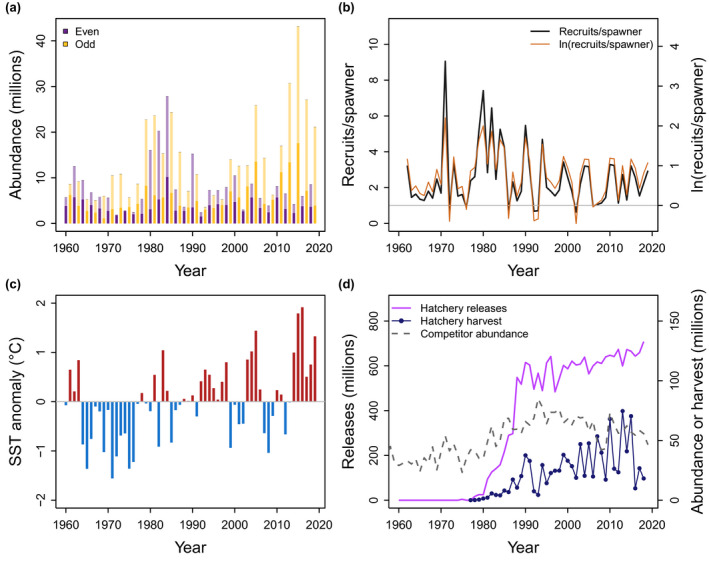
Time series of response and predictor variables. Shown are time series of (a) wild run size as escapement (dark) plus harvest (light) of even‐year (purple) and odd‐year (yellow) pink salmon in PWS, (b) recruits per spawner and ln(recruits/spawner) for wild pink salmon in PWS (gray line indicates replacement at one recruit/spawner), (c) spring sea surface temperature (SST) anomaly in the eastern GoA, and (d) hatchery releases of juvenile pink salmon into PWS (purple, solid line), harvests of adult hatchery pink salmon returning to PWS (blue line and circles), and competitor abundance (sockeye and chum salmon) in the GoA (gray, dashed line)
