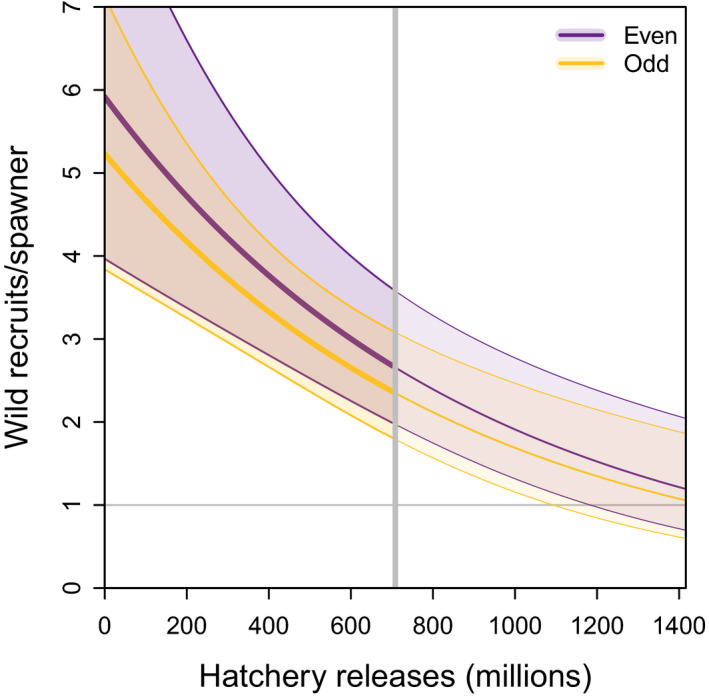
FIGURE 5.

Predicted wild recruits per spawner as a function of hatchery releases. Shown are predictions for the even‐year (purple) and odd‐year (yellow) broodlines during the current regime while setting all other predictors (wild escapement, temperature, total return, competitor abundance) to median values. Thin lines show predictions beyond the highest number of hatchery fish that has been released into PWS (~700 million, gray vertical line). The gray horizontal line indicates population replacement at one recruit per spawner and the gray vertical line indicates the highest historical hatchery releases. Polygons are 95% confidence intervals
