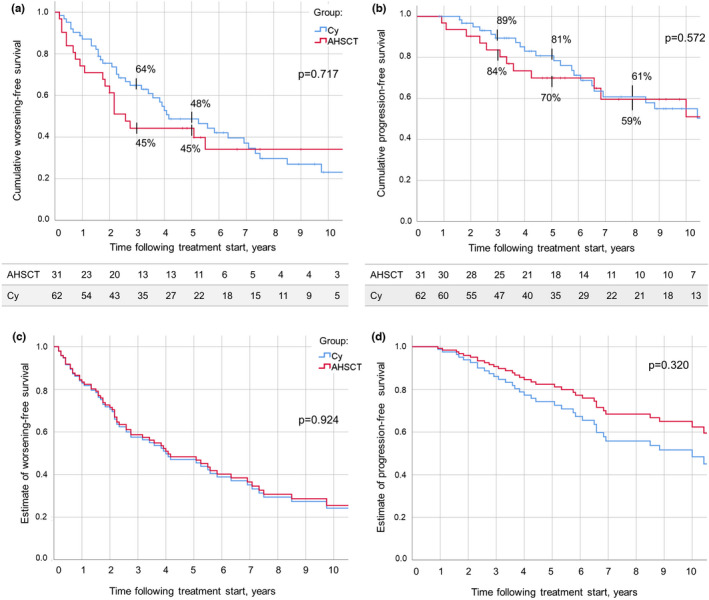
FIGURE 3.

(a) Expanded Disability Status Scale worsening‐free survival (W‐FS) following autologous haematopoietic stem cell transplantation (AHSCT; red) and start of treatment with cyclophosphamide (Cy; blue) up to the last follow‐up available. W‐FS at Year 3 was 45% in the AHSCT and 64% in the Cy group; at Year 5, it was 45% and 48%, respectively (p = 0.717). (b) Disability progression‐free survival (P‐FS) over follow‐up did not differ between the AHSCT group and the Cy group, being at Year 5 following treatment commencement 70% and 81%, respectively (p = 0.572). The number of patients in observation at each timepoint is reported below the corresponding chart. (c, d) Cox estimated distribution of W‐FS (c) and P‐FS (d) in the AHSCT and Cy groups, adjusted for age at treatment, progressive phase duration, and number of previous disease‐modifying treatments received. No differences were observed between the two groups in both the analyses (p = 0.924 and p = 0.320, respectively). These data indicate no differences of effectiveness on disability worsening and on disability progression between the treatments. However, after applying the Cox model, a hint of higher effectiveness of AHSCT can be observed, suggesting insufficient power of this study for this outcome measure [Colour figure can be viewed at wileyonlinelibrary.com]
