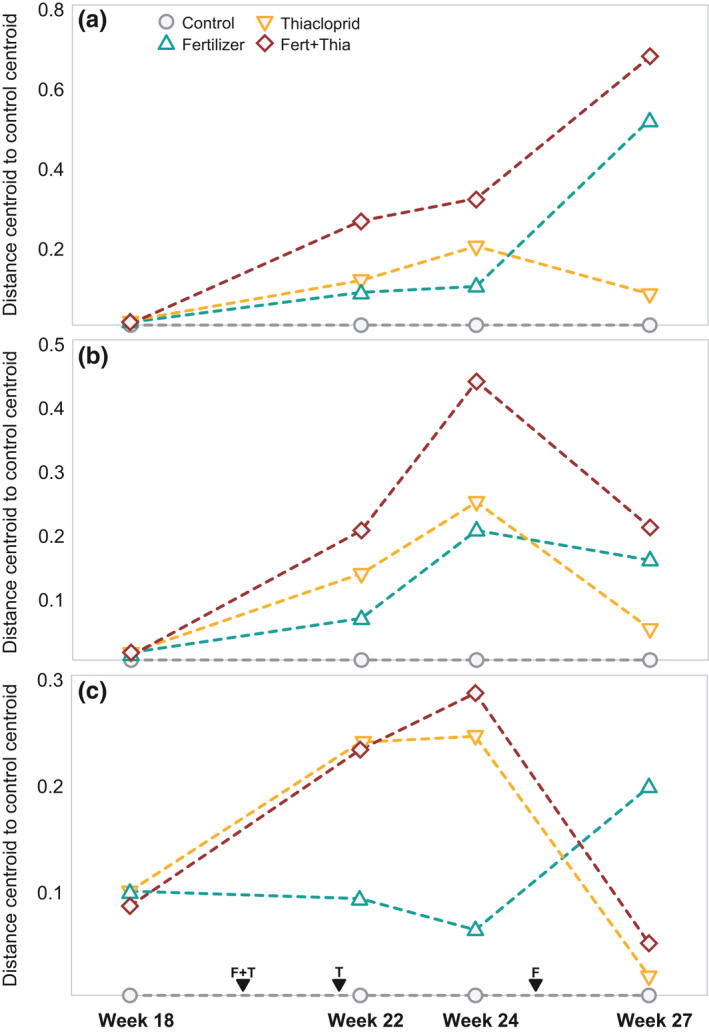
FIGURE 1.

Average distance from centroid to the control centroid, for each of the taxonomic groups. (a) bacteria, (b) phytoplankton, and (c) chironomids. Moments of treatment application for thiacloprid (T) and fertilizer (F) are provided on the x‐axis of panel (c)
